
Calculating MDL & LOQ
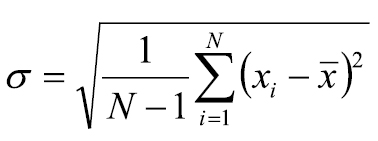
Calculations:Standard Deviation:(see top right) Ϭ = The sample standard deviationN = The number of values in the data setxi = An individual value of the data setx-bar = The mean of the values in the data setMethod Detection Limit (MDL):(see center right)t = “Student’s t value” for the number of replicates at the 99% confidence level. (Can be found in a reference table in a statistics textbook, or on the internet.
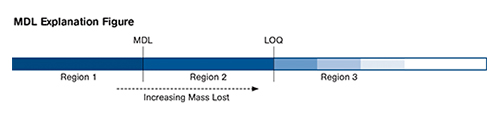
Region 1: Starting from the left at 0 mg, up to the MDL, the instrument can’t reliably differentiate the amount of water lost from the measurement noise. Any result in this region is less than the instrument can detect. Region 2: In this region, between the MDL and the LOQ, the amount of mass loss is greater than 0 with a 99% confidence level, but the actual numerical value has a large degree of uncertainty. Region 3: This region is where the numerical values assigned to the mass loss have a reasonable degree of confidence. You should be able to determine whether your materials are dry or not by producing values from your instrument in Region 3.


Calculations:
Standard Deviation:
(see first image right)
Ϭ = The sample standard deviation
N = The number of values in the data set
xi = An individual value of the data set
x-bar = The mean of the values in the
data set


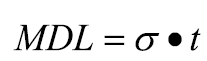
Method Detection Limit (MDL):
(see second image right)
t = “Student’s t value” for the number
of replicates at the 99% confidence level.
(Can be found in a reference table in a statistics textbook, or on the internet. The value changes with the confidence level and the number of replicates used. For this example the student’s t value equals 3.143).
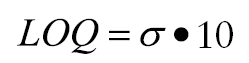
Limit of Quantitation (LOQ):
(see third image right)
Using these calculations with the example data set:
Mean value = 21.94 mg
Standard deviation = 1.02 mg
MDL = 3.2 mg
LOQ = 10.2 mg
Since the instrument detects mass, the detection limits are in units of mass. This means that the percent moisture that can be detected is a function of the sample size. In other words the MDL for a 10-gram sample size would be 3.2 mg/10 g = 0.032%. For a 50-g sample size, the MDL would be 3.2 mg/50 g = 0.0064%. The larger the sample size, the lower the percent moisture you will be able to detect.


