Cycle Time: Science vs. Rules of Thumb—Part 4
While laboratory tests are helpful in determining how polymers behave, you must remember the fundamental differences between laboratory measurements and the real world of plastic processing. Let’s examine semi-crystalline polymers here.
.jpg;width=70;height=70;mode=crop;format=webp)
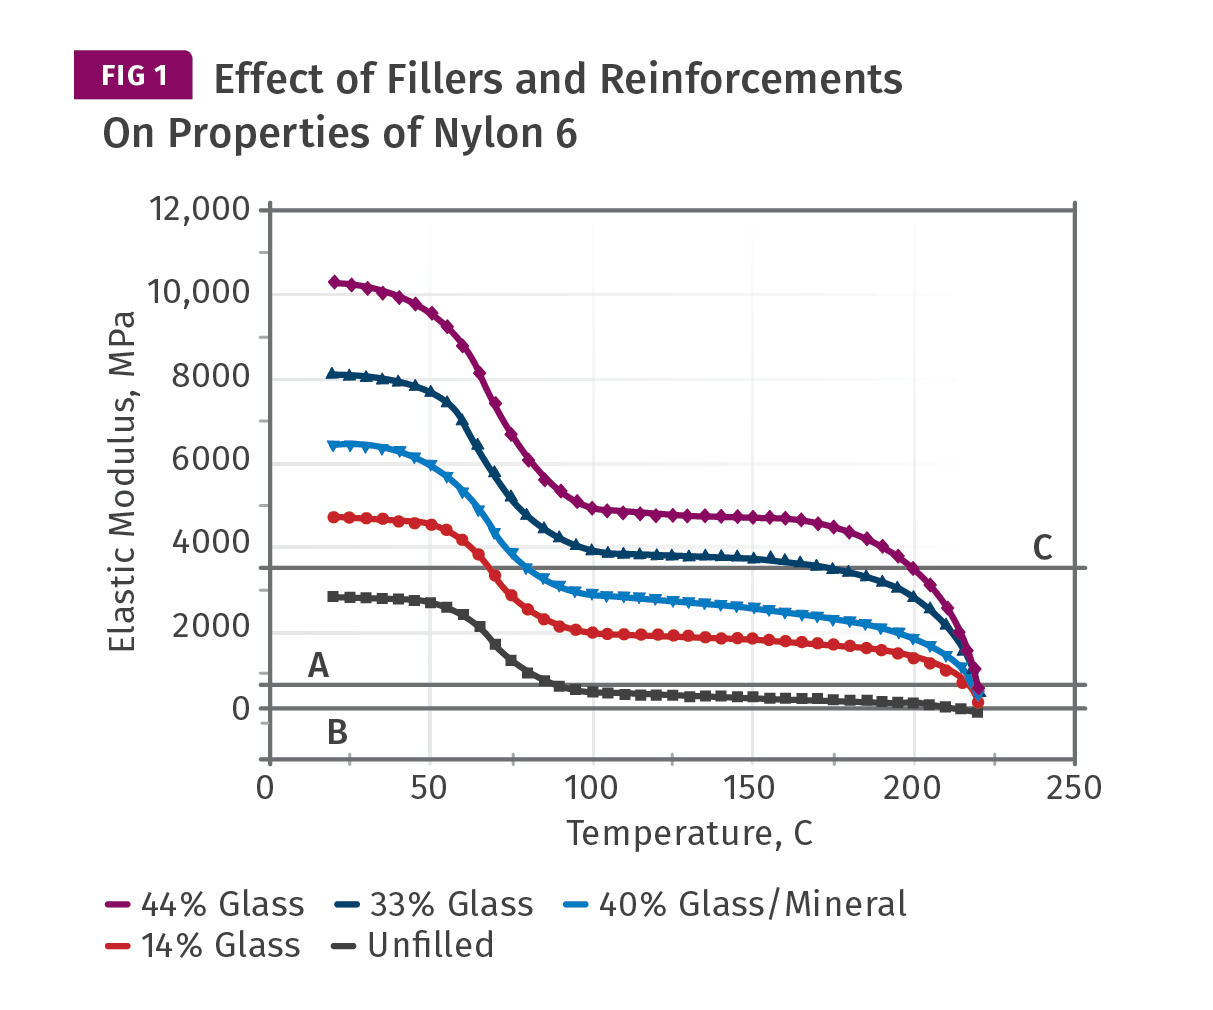
Plots of elastic modulus as a function of temperature for five different grades of nylon 6. Predictably, the unfilled grade has the lowest modulus at all temperatures, while the filled materials exhibit a property profile commensurate with the amount and type of filler incorporated.
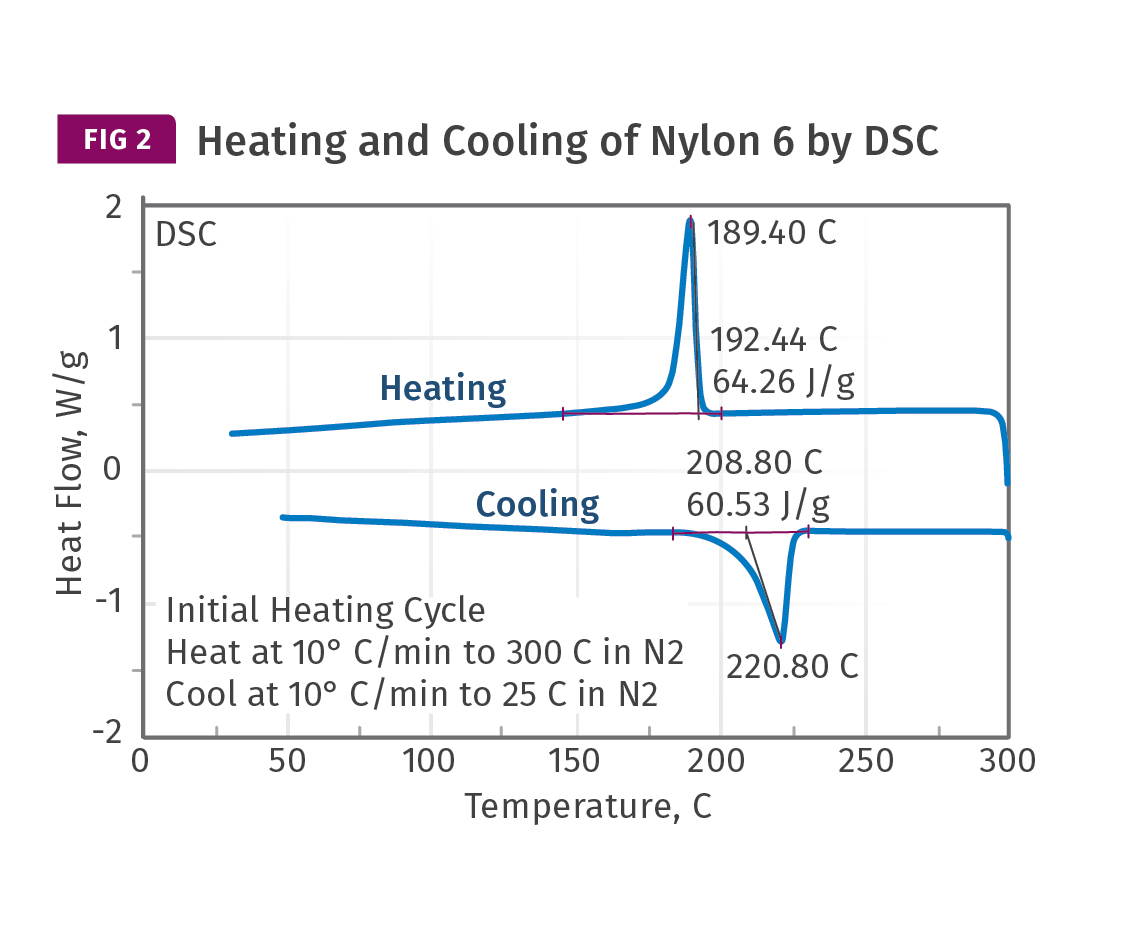
Nylon 6 has a crystalline melting point of approximately 220 C, but analytical tests show that crystals do not begin to form at an appreciable rate until the temperature drops to 180-190 C, and crystallization is not complete until it reaches about 150 C.


In last month’s article, we reviewed the manner in which amorphous polymers develop their properties as they cool, using the technique of dynamic mechanical analysis (DMA). This month, we will examine how a semi-crystalline material goes through this process.
In amorphous polymers, the glass transition is the major event that separates molten from solidified material. We have seen that once the polymer cools through the glass transition, most of the modulus that an amorphous material will display at room temperature has been achieved.


In semi-crystalline materials, the picture is quite different. As semi-crystalline materials cool, the first event that signals the development of solid-state properties is the formation of crystals. Crystals begin to form when the temperature of the material drops below the melting point and they continue to form until the material temperature drops below the glass-transition temperature. The more crystals that form, the stronger and stiffer the material will be. Figure 1 shows a series of plots for elastic modulus as a function of temperature for five different grades of nylon 6. One of these is unfilled and predictably has the lowest modulus at all temperatures, while the filled materials exhibit a property profile commensurate with the amount and type of filler incorporated.
Quench cooling the material can interfere with the very process that promotes modulus development.
These graphs were developed by heating the samples, so they do not precisely capture how
the modulus will develop as the materials cool. Due to the large size of the molecules, the melting point and the recrystallization temperature are not the same in a polymer the way they are in a metal or in a material like ice. As shown in Fig. 2, nylon 6 has a crystalline melting point of approximately 220 C (428 F), but analytical tests show that crystals do not begin to form at an appreciable rate until the temperature drops to 180-190 C (356-374 F) and crystallization is not complete until we reach about 150 C (302 F). It is unfortunate that this offset between melting and recrystallization in polymers is not fully understood by many in the industry. I have seen “guidance” given in online technical threads indicating that crystals begin to form in a material as it cools to the melting point, when in reality it is necessary to reduce the temperature well below the melting point to induce crystallization, even when a material is significantly nucleated.
Once crystals begin to form, the modulus of these nylon materials will increase along a path that is approximately described by the curves in Fig. 1. As the unfilled material reaches the point where it is about to go through the glass transition, it will have achieved a modulus that is approximately 20% of what it will ultimately reach at room temperature. If the objective is to develop as high a degree of crystallinity as practically possible, mold temperatures in the range of 85-100 C (185-212 F) are ideal. The molecular mobility required to form crystals requires a temperature above the glass-transition temperature (Tg). Once the temperature begins to decline through the glass transition, crystal formation slows down and eventually stops altogether, but the modulus increases more rapidly and allows for a shorter cycle time. This is the balancing act that processors running semi-crystalline materials must negotiate, whether they know it or not.
Higher mold temperatures promote a more fully crystallized structure, which enhances a host of properties, including dimensional stability, strength, modulus, fatigue resistance, and creep resistance. Lower mold temperatures can reduce cycle time at the expense of these performance characteristics. Too often, the cycle-time considerations prevail and the mold temperature is reduced well below the optimal range because of a belief that this will shorten the cycle. Unfortunately, quench cooling the material can interfere with the very process that promotes modulus development. Therefore, an inferior part is often produced and the cycle-time reduction is not realized anyway.
Once a filler is introduced, things become a little less delicate. The filled materials exhibit a significantly higher modulus above Tg and it becomes far more likely that a part produced in even a lightly filled material will reach an ejectable modulus while still above the Tg. This allows for the use of higher mold temperatures without sacrificing cycle time, and the higher the filler content the faster the cycle should be. You may be wondering about the horizontal lines labeled A, B, and C in Fig. 1. These are the modulus values that Takemori associated with the heat deflection temperatures that are often incorporated into the equations used to calculate cycle time. ‘A’ is the modulus associated with the HDT test performed at 264 psi (1.8 MPa). ‘B’ is associated with the HDT test performed at 66 psi (0.455 MPa). ‘C’ is related to a relatively new protocol that appears in the ISO standard but not in the ASTM standard. It employs a stress of 1160 psi (8.00 MPa). So the question then becomes, which HDT are we supposed to use in our algorithms?
It should be reasonably obvious that being able to view the modulus as a continuum of values as a function of temperature is far more useful than trying to assign some special significance to a point on the curve that has no intrinsic importance. The modulus at which any given part can be ejected from a mold without concerns about immediate distortion or subsequent excessive shrinkage will depend upon several factors, including draft angles, mold surface finish, and the area of the part to which ejection forces are applied.
It should also be understood that as valuable as the analytical data is in promoting an understanding of the behavior of polymers, these tests are performed under conditions that are quite different from those encountered in the processing environment. Heating and cooling rates in the laboratory are typically very slow. DSC (differential scanning calorimetry) samples are heated and cooled at 10° C (18° F) or 20° C (36° F)/min, and DMA samples are heated at 1-2° C (1.8-3.6° F)/min. In a typical molding process, the cooling rate can be 200-300° C (360-540° F)/min. In addition, there is no shear generated in a lab instrument, while shear is a major contributor to the state of the material in the molding machine. As we refine our knowledge of the behavior of these materials, we still need to be aware of these fundamental differences between laboratory measurements and the real world of plastic processing.
Nylons are examples of a semi-crystalline material with a glass- transition temperature above room temperature. But there are some commercial semi-crystalline polymers that never cool below their Tg unless exposed to very low temperatures. At ambient conditions, they remain above the Tg. These materials develop their properties somewhat differently than high-performance materials such as nylons, polyesters, and PPS. In our next installment, we will look at these materials more closely using the same analytical tools we have employed here.
ABOUT THE AUTHOR Mike Sepe is an independent, global materials and processing consultant whose company, Michael P. Sepe, LLC, is based in Sedona, Ariz. He has more than 40 years of experience in the plastics industry and assists clients with material selection, designing for manufacturability, process optimization, troubleshooting, and failure analysis. Contact: (928) 203-0408 • mike@thematerialanalyst.com.
Related Content

Are Your Sprue or Parts Sticking? Here Are Some Solutions
When a sprue or part sticks, the result of trying to unstick it is often more scratches or undercuts, making the problem worse and the fix more costly. Here’s how to set up a proper procedure for this sticky wicket.
Read More
Improve The Cooling Performance Of Your Molds
Need to figure out your mold-cooling energy requirements for the various polymers you run? What about sizing cooling circuits so they provide adequate cooling capacity? Learn the tricks of the trade here.
Read More
Know Your Options in Injection Machine Nozzles
Improvements in nozzle design in recent years overcome some of the limitations of previous filter, mixing, and shut-off nozzles.
Read More
A Simpler Way to Calculate Shot Size vs. Barrel Capacity
Let’s take another look at this seemingly dull but oh-so-crucial topic.
Read MoreRead Next

Materials—Cycle Time: Science vs. Rules of Thumb—Part 3
To properly calculate cycle time, you need to understand how the modulus of a polymer increases as it cools in the mold.
Read More
Troubleshooting Screw and Barrel Wear in Extrusion
Extruder screws and barrels will wear over time. If you are seeing a reduction in specific rate and higher discharge temperatures, wear is the likely culprit.
Read More
Lead the Conversation, Change the Conversation
Coverage of single-use plastics can be both misleading and demoralizing. Here are 10 tips for changing the perception of the plastics industry at your company and in your community.
Read More