Improve Profits by Graphing Injection Pressure
Graphing is a powerful aid in optimizing the process and troubleshooting both process and machine issues.
.jpg;width=70;height=70;mode=crop;format=webp)
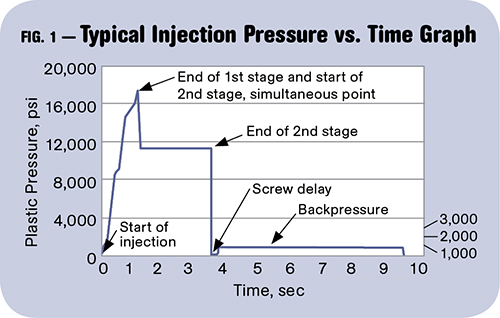
This is a typical graph of injection pressure vs. time, with the machine sequences noted. All curves will not look like this, but this represents a typical process. Note that the vertical axis is plastic pressure; a curve of hydraulic pressure will look the same but with a different scale.
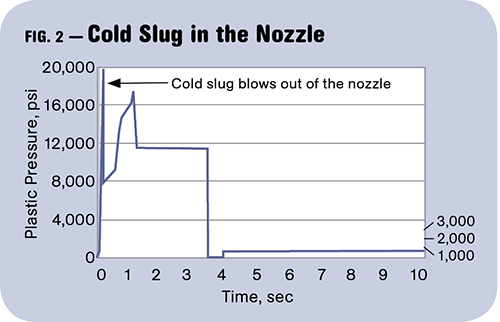
This shows what a cold slug in the nozzle looks like. Again, this is injection pressure vs. time. Ability to overlay the graph for every cycle would enable the processor to watch the spike grow with each new shot.


Most newer injection molding machines with faster microprocessors now have some graphing capabilities. Usually injection pressure, injection velocity, screw position, and sometimes even backpressure can be plotted vs. time or screw position. This graphing capability offers real help in understanding the process and machine.
So take some time and see if you can figure out how to turn it on and set up the scales to your liking. This will not be as capable as a full process-monitoring system, but it’s a good start. Graphing is a powerful aid in optimizing the process and troubleshooting both process and machine issues.


First, make sure you are dealing with good data. My criteria:
1. Speed of data logging. My preference is data logged at the rate of at least 100 points/sec—1000 points/sec is even better during fast machine events like injection. Logging data at only 10 points/sec can miss some important events, yet it is fine for slow events like second-stage injection pack and hold.
2. Ability to properly scale both the vertical and horizontal axes.
3. Ability to pick the variable of interest, for example injection pressure or screw position.
4. Ability to pick time as the horizontal axis. This is perhaps the most frustrating issue on many machines. Often you will find first-stage injection plotted vs. screw position as the horizontal axis and then changing to time as the horizontal axis at switch-over from the first to second stage. Worse, the two plots are not connected, and how this switchover point happens is critical for good processing. Processors and maintenance need to see it clearly as one continuous curve, so use time as the horizontal axis.
5. Ability to overlay graphs of different variables for one cycle or for several cycles.
6. Ability to plot first-stage injection, second-stage pack/hold, and backpressure on one graph. Not seeing all together seriously limits processing and maintenance folks’ ability to use the data.
7. Ability to select the color of the graph.
All this may sound simple, but remember that the first priority of the controller is to control the machine cycle. Data gathering and manipulation are secondary and have to take a back seat to critical machine functions. So it may not get the computer power or time to do high-speed data gathering or storage. You may need dedicated process-monitoring equipment to get the information you want.
Now that you are collecting good data, what can you learn from these plots? Here’s a partial list:
•Is the machine repeatable?
•Do you have a cold slug problem in the nozzle tip?
•Are you pressure limited on first stage?
•Is second stage stable or trending?
•Is machine response appropriate at switchover from first to second stage?
•Are you starting to turn the screw with too much pressure on it?
•Is backpressure stable?
•Is there a difference between peak injection pressure and pressure at transfer during injection?
•If there is a glitch in machine function can you readily see if it is in first, second, or backpressure stages?
To illustrate the benefits of doing this, refer to Figs. 1 and 2. Begin by looking at only one curve at a time. Two or more can be confusing. Understand what graphing one process variable tells you before going on to another. Keep the same color for each process variable; for example, make injection pressure red for all machines. This saves time in interpretation. Again, try to keep the horizontal axis for the time scale.
Figure 1 is a typical graph plotting injection pressure vs. time, with the machine sequences noted. If you could overlay several shots you could easily see if the machine was repeatable; and if there was a machine glitch, you could easily tell in what stage it was occurring on and if it was on every shot or “random.”
Figure 2 shows what a cold slug in the nozzle looks like. Again, this is injection pressure vs. time. In this case, having the ability to overlay the graph for every cycle would enable the processor to watch the spike grow with each new shot. The cold slug spike would start out small and grow higher with every cycle. The longer the nozzle is in contact with the cold-runner sprue-bushing the more heat loss and the higher the cold slug spike. Interrupt the cycle and pull the injection unit back and the spike would be lower again upon startup.
Note that this cold slug will not always be caught in the cold-slug well. It can easily wind up blocking or restricting a gate. But now you have documentary evidence of the cold slug—it is not just a matter of opinion, so there’s an end to time-wasting arguments. To remedy, make sure the controlling thermocouple is back one-third the length of the nozzle; try to have a free-flow nozzle tip; reduce the tip land; and reduce the tip’s contact area to minimize heat loss.
Understanding the intricacies of these graphs will provide better part consistency, process understanding, and faster troubleshooting. Profits will improve.
Related Content

How Much L/D Do You Really Need?
Just like selecting the extruder size and drive combination, the L/D should be carefully evaluated.
Read More
The Strain Rate Effect
The rate of loading for a plastic material is a key component of how we perceive its performance.
Read More
Why (and What) You Need to Dry
Other than polyolefins, almost every other polymer exhibits some level of polarity and therefore can absorb a certain amount of moisture from the atmosphere. Here’s a look at some of these materials, and what needs to be done to dry them.
Read More
Understanding Strain-Rate Sensitivity In Polymers
Material behavior is fundamentally determined by the equivalence of time and temperature. But that principle tends to be lost on processors and designers. Here’s some guidance.
Read MoreRead Next

Understanding Melting in Single-Screw Extruders
You can better visualize the melting process by “flipping” the observation point so that the barrel appears to be turning clockwise around a stationary screw.
Read More
Lead the Conversation, Change the Conversation
Coverage of single-use plastics can be both misleading and demoralizing. Here are 10 tips for changing the perception of the plastics industry at your company and in your community.
Read More
People 4.0 – How to Get Buy-In from Your Staff for Industry 4.0 Systems
Implementing a production monitoring system as the foundation of a ‘smart factory’ is about integrating people with new technology as much as it is about integrating machines and computers. Here are tips from a company that has gone through the process.
Read More