
Internal Benchmarking: Setting Targets
Last month, we discussed how to graph your plant’s “process energy fingerprint.” Now we’ll show you how to make use of that information.


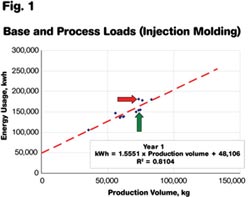
Fig. 1—Arrows highlight two points where similar production volume generated a 15% difference in energy usage. This helps managers focus on finding out what caused the difference.
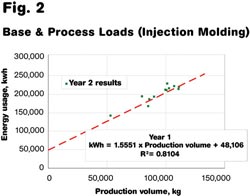
Fig. 2—Year 1 PCL sets a standard, or internal benchmark, for Year 2 performance. Energy usage was generally higher for the same production levels in Year 2.
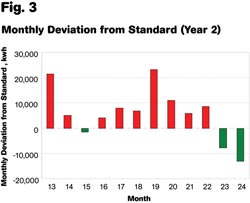
Fig. 3—Graphing the monthly deviation from standard makes the magnitude and timing of deviations from standard more apparent than in Fig. 2.
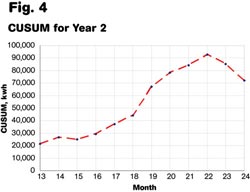
Fig 4—In a Cumulative Sum (CUSUM) graph, the slope of the curve tells when performance was better or worse than standard and whether it was deteriorating or improving.
Last month, we discussed how to graph your plant’s “process energy fingerprint.” Now we’ll show you how to make use of that information. The energy fingerprint consists of the fixed “base load” and the variable “process load.” The latter is related to the slope of a line called the Performance Characteristic Line (PCL). One of the most important uses of the Performance Characteristic Line (PCL) is for assessment of plant performance relative to an internally generated standard.
For the example shown in Fig. 1, the equation for the PCL is kwh = (1.5551 x Production volume) + 48,106. This can be used to predict and assess energy usage for the plant. For instance, if the production volume for the month is 70,000 kg, then the predicted energy usage will be (1.5551 x 70,000) + 48,106 = 156,963 kwh. At 7¢/kwh, the predicted energy cost is $10,987.


Managers now have a direct and simple method for assessing energy usage and assigning production accountability:
- Set up a simple spreadsheet or chart to use the PCL to calculate the predicted kwh for a given production volume.
- Determine the volume of material processed in a month and calculate the predicted energy usage.
- Determine the actual energy usage for the month.
- Compare the predicted energy usage to the actual energy usage.
- If the actual energy usage is less than the predicted energy usage then the plant performed better than it has done historically. Find out what the plant did right and do more of it.
- If the actual energy usage is more than the predicted energy usage then the plant performed worse than it has done historically. Find out what the plant did wrong and do less of it.
WHAT WENT WRONG?
Consider the two points pointed out by arrows on the graph in Fig. 1. These have nearly identical production volumes (73,567 kg vs. 73,557 kg), but their energy usage differs by 27,201 kwh (153,690 vs. 180,891 kwh). That’s a 15% increase for no additional production volume. Plant managers should investigate this difference because it has cost them $1904 (at 7¢/kwh).
The PCL is a tool to both set energy use targets and to allocate responsibility to the relevant managers. The PCL does not provide external benchmarking—i.e., it does not tell you whether you are doing any better or worse than your peers in efficient energy usage. The PCL is based on the historical performance of the plant and only assesses its current performance against past performance. That is the meaning of internal benchmarking.
The PCL is generally established for one year and then used to monitor performance for subsequent years. Fig. 2 shows the Year 1 PCL and the data points for Year 2. It is apparent that for most months in Year 2, the achieved performance is worse than the standard set in Year 1.
However, a plot like Fig. 2 can be misleading, because it might suggest that the site is operating close to the predicted performance, albeit a little worse. To better gauge the magnitude (and timing) of the deviations, it is better to plot the deviation from standard for each month, as in Fig. 3. Here it is glaringly obvious that performance in Year 2 has been consistently worse than in Year 1.
It is even better to look at the CUSUM (cumulative sum) of the deviations in a graph that tracks the total of the deviations over the year. This is easily presented using a spreadsheet and the plant data. A CUSUM plot quickly identifies trends and changes in performance. As shown in Fig. 4, it is clear that things were getting worse for Months 13 to 22, and most dramatically so in months 19 and 20, though equally rapid improvement was achieved in months 23 and 24.
The important thing with CUSUM charts is not the absolute value of the CUSUM; it is the slope of the curve and any changes in this slope:
- A rising curve shows that energy usage is consistently higher than the standard, and an increase of slope indicates performance is getting progressively worse.
- A falling curve shows that usage is consistently better than the standard—i.e., performance is getting better.
- A flat (or substantially flat) curve shows that performance is stable and matches the standard.
WEEKLY DATA COLLECTION
All the data presented so far has been in terms of monthly values, but it is often better to use weekly data. This has many advantages:
- The PCL can be created much faster , since a PCL should be based on at least 12 data points.
- It is easier to correlate energy use and production volume for shorter periods.
- Feedback to production managers is faster.
- Activities that cause excessive energy use are identified (and fixed) quicker.
- There is closer control of the improvement process.
Many companies have no formal budgeting procedure for energy costs. This makes budgeting a case of “think of a number and add some contingency” or a similarly unscientific approach. The PCL makes predicting energy usage and costs easy and objective:
- Convert the sales forecast into a monthly production volume (kg).
- Convert the energy use (kwh) into energy cost using the current or future cost of energy.
- The energy cost is now seen as being directly related to the production volume. Finance now becomes involved in the control and management of energy costs (previously seen as simply an allocation of a fixed cost). This method also allows rapid recalculation of the predicted energy costs according to the inevitable changes in sales forecasts or the cost of energy.
About the Author
Dr Robin Kent is founder and managing director of Tangram Technology Ltd. in Hitchin, Herts., U.K. Tangram provides consulting engineering, training, and design services to plastics processors. Kent has been involved in injection molding and extrusion for 36 years and has worked as technical director for several major plastics processing companies in the U.K. and Europe. He can be reached at rkent@tangram.co.uk or visit www.tangram.co.uk. Articles in this series are adapted from his book, Energy Management in Plastics Processing (2008, 265 pages, www.pidbooks.com).


Related Content

How to Configure Your Twin-Screw Barrel Layout
In twin-screw compounding, most engineers recognize the benefits of being able to configure screw elements. Here’s what you need to know about sequencing barrel sections.
Read More
Sustainability Among the Many Niches at Niche Polymer
Founded in 1987, Niche Polymer continues to grow—both organically and through acquisition—by focusing its product-development efforts on ever-changing market needs. Adding value to both industrial and post-consumer scrap is a growing part of this effort.
Read More
10 Ways to Improve Twin-Screw Compounding Performance
There are many techniques known to operators and plant engineers for increasing the performance of a twin-screw compounding extruder.
Read More
LFT-D Thrives in Automotive and Other Durables
Teijin Automotive acquires its 10th direct long-fiber thermoplastic system as demand for this technology soars.
Read MoreRead Next

What’s Your Process Energy Fingerprint?
As we discussed in last month’s column, your plant’s “energy fingerprint” is composed of the base load and the process load.
Read More
Know Your Plant’s ‘Energy Fingerprint’
It is commonly thought that energy use in plastics processing is fixed and uncontrollable.
Read More
How Polymer Melts in Single-Screw Extruders
Understanding how polymer melts in a single-screw extruder could help you optimize your screw design to eliminate defect-causing solid polymer fragments.
Read More