
Know Your Plant’s ‘Energy Fingerprint’
It is commonly thought that energy use in plastics processing is fixed and uncontrollable.


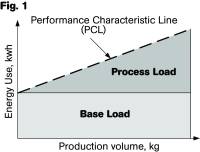
Fig. 1—A plant’s “energy footprint” consists of the fixed base load (“overhead”) and the variable process load.
Fig. 2—Scatter chart for an actual injection molding plant. Where the PCL best-fit line intersects the vertical axis is the plant’s base load. The slope of the PCL is the process load.
Fig. 3—An inefficient molding plant has a high base load, low PCL slope, and poor correlation coefficient (less than 0.7).
Fig. 4—A highly efficient molding plant has a low base load, high PCL slope, and high R2 correlation.
It is commonly thought that energy use in plastics processing is fixed and uncontrollable. Many plants simply give up trying to control it. The reality is that energy use varies directly with production volume and is easily controlled. There are no excuses. Energy use is variable and controllable. Energy usage at a plastics processing plant consists of a base load and a process load. The base load is the energy used in lighting, heating, compressed-air leakage, and all the other non-volume-dependent uses. The process load is the load that is directly related to the production volume. These can be combined to give the Performance Characteristic Line (PCL), which describes the energy performance of the site (see Fig. 1).


THE ENERGY FINGERPRINT
For a plastics plant, irrespective of the process, it is possible to find the base and process loads from simple, easily available energy usage and production volume data. Record the production volume (in lb or kg) for a number of months and record the energy usage (in kwh) for the same period. It is important that the production-volume and energy-usage data-measurement periods coincide.
Plot a scatter chart of the kwh energy usage versus pounds or kilograms processed for a minimum of 12 data points. This can be done in most spreadsheets.
Use the spreadsheet to fit a straight line of best fit to the data points and find the equation of the line of best fit. Extrapolate the line of best fit back to the vertical axis. This line is the plant’s Performance Characteristic Line (PCL).
The intersection of the PCL with the vertical Energy Usage axis is the “base load” for the site. This is the energy usage when no effective production is taking place but machinery and services are available.
The slope of the PCL is the “process load” for the site and shows the average energy usage to process each pound or kilogram of polymer.
Real data from a European injection molding plant is shown in Fig. 2. The equation for the PCL of the sample data is:
kwh = 1.5751 x Production Volume + 152,440.
The energy cost for this site consists of a base load of 152,440 kwh and a process load of 1.5751 kwh/kg of plastic processed.
(Note that the correlation coefficient, or R2, for the PCL in this example is 0.9397, showing excellent correlation between the data and the line of best fit, or PCL. See sidebar for an explanation of R2.)
BASE & PROCESS LOADS
The base load information implies that even if no production is taking place in this plant, it will still consume around 152,440 kwh/month. The total cost of the base load (at $0.07/kwh) is about $10,700/month or $128,000/yr, and the base load is roughly 30% of the plant’s energy use. This is average for plastics processing, where typical base loads are between 10% and 40% of total energy use.
The base load is effectively an energy “overhead” and is generally due to machinery or services being left on with no productive output. The base load comprises energy losses to compressed-air leaks, parasitic heat gain in cooling-water piping, lights left on with no production, conveyors operating with no production, etc. Reductions in the base load (which move the PCL downwards) can often be made without affecting production rates, quality, or operations. These savings are very profitable because the base load is largely a dead weight that is unrelated to production output.
The process load information shows that this plant uses 1.5751 kwh/kg of plastic processed. The process load indicates how efficient the company is at plastics processing. Reductions in the process load (reducing the slope of the graph) indicate improved process efficiency or machine utilization. These are often more difficult to achieve than reductions in the base load.
Separating the base and process loads is often a difficult task because many loads have both a fixed and a variable element. This is similar to accounting, where all costs can be nominally divided into fixed and variable costs, but the reality is that most costs have both a fixed and a variable element. Despite this difficulty, the division of the loads using the PCL can reveal profitable areas for improvement by plant management and give excellent information on plant operations. Plastics processors need this type of information for correct targeting of improvements in both the base and process loads.
READING THE CHARTS
The PCL reveals a great deal about a company’s operations and simple analysis can enable management to “see inside” the process. Poor energy management and out-of-control energy usage will show up very clearly on the PCL. The PCL will have a high base load, a lower than normal process load and high scatter in the results (a low R2 value).
The base load will be high because processes and services are left on whether the site is producing any product or not. The process load will be lower than normal because much of the normal process load will be effectively converted to base load—i.e., it is not seen as a variable process load but as a fixed base load. The high scatter will result from the poor linearity between energy usage and production volume.
(Note: When the scatter is large it is also possible that the data collection periods for the energy usage and production volume are not properly aligned. This should be checked first to ensure data integrity.)
POOR ENERGY MANAGEMENT
Figure 3 shows the PCL for another injection molding plant. This type of PCL generally indicates poor energy management, but it also indicates a high potential for improvement if the plant’s management takes positive action. Base load energy reductions are generally low-cost and easy to make and have rapid payback.
Good energy management will also show up very clearly on the scatter chart. At this type of plant, the chart will have a low base load, a higher than normal process load, and low scatter (high R2 value).
The base load will be low because processes and services are turned off when the plant is not producing any product. The process load will be higher than normal because all of the process load will be seen as a variable load—i.e., very little of the process load will be seen in the fixed base load. The low scatter will result from the good linearity between energy usage and production volume.
Fig. 4 shows an example of excellent energy management in injection molding. This type of performance does indicate a reduced potential for improvement. Management actions must be concentrated on reducing the process loads, which generally requires more fundamental and expensive process improvements.
About the Author
Dr Robin Kent is founder and managing director of Tangram Technology Ltd. in Hitchin, Herts., U.K. Tangram provides consulting engineering, training, and design services to plastics processors. Kent has been involved in injection molding and extrusion for 36 years and has worked as technical director for several major plastics processing companies in the U.K. and Europe. He can be reached at rkent@tangram.co.uk or visit www.tangram.co.uk. Articles in this series are adapted from his book, Energy Management in Plastics Processing (2008, 265 pages, www.pidbooks.com).


Related Content

Machine-Side and Central Chiller Lines, Industry 4.0 Controls to Launch
Frigel will use K 2022 to showcase a number of developments in process cooling, including new and expanded lines of central and machine-side chillers, as well as advanced control platforms.
Read More
Cooling the Feed Throat and Screw: How Much Water Do You Need?
It’s one of the biggest quandaries in extrusion, as there is little or nothing published to give operators some guidance. So let’s try to shed some light on this trial-and-error process.
Read More
High-Temperature, Low-Flow Indicator for Mold-Cooling Applications
Burger & Brown Engineering has released a new high-temperature low-flow indicator to monitor flow inside critical, restricted cooling paths such as those with bubblers or baffles.
Read More
Wisconsin Firms Unite in Battle Against Covid
Teel Plastics opened new plant in record time, partnering with AEC & Aqua Poly Equipment Co. to expand production of swab sticks to fight pandemic.
Read MoreRead Next

Lead the Conversation, Change the Conversation
Coverage of single-use plastics can be both misleading and demoralizing. Here are 10 tips for changing the perception of the plastics industry at your company and in your community.
Read More
Understanding Melting in Single-Screw Extruders
You can better visualize the melting process by “flipping” the observation point so that the barrel appears to be turning clockwise around a stationary screw.
Read More
Processor Turns to AI to Help Keep Machines Humming
At captive processor McConkey, a new generation of artificial intelligence models, highlighted by ChatGPT, is helping it wade through the shortage of skilled labor and keep its production lines churning out good parts.
Read More