MATERIALS: Analysis Gone Wrong: Part 2
But even misinterpreted tests can yield an approximation of the real composition of the material.
In Part 1 of this article last month, we established that thermogravimetric analysis (TGA) can be an excellent tool for determining the composition of grades of material that contain more than one polymer, as long as the polymers are sufficiently different in the way they decompose with increasing temperature. However, in the case of polycarbonate modified with PTFE, the method falls short because of the overlap in the temperatures at which the two materials decompose.
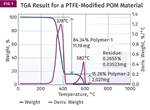
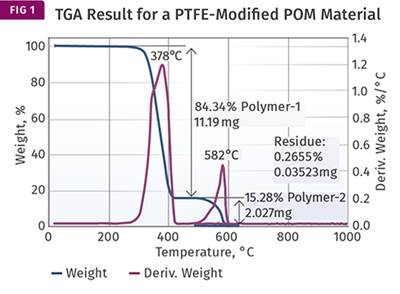
Figure 1 represents the result that we showed last month, to remind everyone of what we are dealing with. The overlap is clearly visible. Unfortunately, the analyst identified a second distinct weight loss as decomposition of the PTFE. And because the value associated with that weight loss was close to the quantity of PTFE that was expected (15%), the material was pronounced as meeting the specified composition requirements. This points out a pitfall that analysts much constantly watch out for—we tend to believe a result when it coincides with what we expect.
Despite the fact that the results were misinterpreted, the tests are not necessarily a waste of time and effort. If we apply our knowledge of the behavior of the materials that are involved, we can still obtain at least an approximation of the real composition of the material. The first thing that we need to know is that when polycarbonate undergoes pyrolysis, a process of thermal decomposition in the absence of oxygen, approximately 25% of the material remains as a carbonized char. This occurs due to the chemical structure of the polycarbonate backbone. The 25% value is not a precise constant. It can fluctuate a little depending upon the particular grade of material being evaluated. But if enough TGA tests are performed, the result will typically fall in the range of 24-25% for a natural grade of the polymer. PTFE, on the other hand, produces no char at all when pyrolyzed.
Since we can attribute all the char to the polycarbonate, and we know that this char represents approximately 25% of the polycarbonate, we can take the 14.78% from Fig. 1 and multiply it by 4 to obtain the total amount of polycarbonate in the compound. This gives us 59.12%. The amount of glass fiber is already known from the ash content to be 29.18% (close to the specified 30% level). Adding these together we have accounted for 88.30% of the sample, which leaves us with 11.7% of the compound not yet identified.
This admittedly does not represent an exhaustive breakdown of every ingredient that could be in the material. There will be an additive package that may account for between 0.5% and 1% of the recipe. And if these parts were black and the formulator had used carbon black as the colorant, we would have to be cautious with our calculation because some of the char would be due to the presence of the carbon black. But if we are careful we can use prior knowledge of the structure of a material to extract information from even a flawed methodology.
Interestingly, another modified PC part in this case produced a char content of 13.94% and a glass fiber loading of 29.68%. Because the analyst was considering the char weight loss to represent the PTFE, he felt that this difference of less than 1% from the other part tested was insignificant. However, if we understand that the char weight loss is only 25% of the PC portion of the compound and we repeat the calculation above we get a different view. Multiplying 13.94 by 4 and then adding in the 29.68% glass gives us a total of 85.44%, leaving 14.56% for the PTFE, a difference of nearly 3% (vs. 11.7%) and much closer to the specified 15%.
Is this the reason why one part may be ductile and another is brittle? Probably not. PTFE does influence the properties of the base resin into which it is incorporated, and in PC it will produce a decrease in strength and modulus and will reduce toughness to a degree. However, the difference in the ductility of the two parts tested in this case went well beyond the effects that could be expected from an apparent shift of 3% in the PTFE content. So in any event, additional work is required to arrive at root cause.
However, the purpose of this particular analysis was to compare the composition of the material in the two parts. The results were interpreted to show that the materials were comparable and within specification when they were not. In addition, specific responses in the test results were interpreted incorrectly.
As is usually the case, there are multiple approaches to obtaining the desired answers for things like composition, and often multiple tests are needed to refine the answer. Often the “go to” test for composition in polymers is Fourier-transform infrared spectroscopy (FT-IR). Unfortunately, there tends to be an over-reliance on this method and it is often the first and last test performed.
In this case it would present the analyst with a very bewildering result because the infrared spectrum for PTFE cannot be seen in a compound where PC is the main ingredient. Some of the spectral peaks in PC coincide with the few peaks that exist in the PTFE spectrum and therefore the PTFE “hides behind” the PC. An analyst who is not aware of this might report that there was no PTFE in the sample because FT-IR did not show any evidence of it.
A viable alternative would be differential scanning calorimetry (DSC), a technique that detects transition temperatures such as softening and melting points. PTFE has a distinct melting point at 327-330 C where there is no interference from the polycarbonate. The intensity of the melting event can be related in a relative manner to the concentration of the PTFE in the compound. So a comparison of the two parts should verify the differences suggested by a proper interpretation of the TGA tests.
An even more quantitative approach would be an elemental analysis. There are several different analytical techniques that can detect and quantify the various elements in materials. This technique is not used often in polymers (it is more common among metallurgists) because all we expect to find in most cases are carbon and oxygen. But PTFE contains fluorine, an element that distinguishes it from most other polymers. And we know that by weight fluorine makes up 76% of the PTFE molecule. So a method that can quantify elemental fluorine is one of the most direct ways of measuring the PTFE content in a compound.
Good analysis starts with selecting the right tools. In polymers, there are 50+ different analytical techniques. Most analysts are highly trained in four or five, and we tend to gravitate toward the things we are good at and familiar with. But sometimes the right tool is outside our comfort zone and we find ourselves in an uncomfortable situation. Starting with the fundamentals of how to best answer questions will lead to the right test plan if the analyst listens and thinks broadly enough. Next month we’ll discuss an application where TGA was the right test, but the composition of the particular material being tested led to an easily corrected reporting error.
Related Content
PBT and PET Polyester: The Difference Crystallinity Makes
To properly understand the differences in performance between PET and PBT we need to compare apples to apples—the semi-crystalline forms of each polymer.
Read MoreUnderstanding Strain-Rate Sensitivity In Polymers
Material behavior is fundamentally determined by the equivalence of time and temperature. But that principle tends to be lost on processors and designers. Here’s some guidance.
Read MoreFundamentals of Polyethylene – Part 6: PE Performance
Don’t assume you know everything there is to know about PE because it’s been around so long. Here is yet another example of how the performance of PE is influenced by molecular weight and density.
Read MoreThe Effects of Time on Polymers
Last month we briefly discussed the influence of temperature on the mechanical properties of polymers and reviewed some of the structural considerations that govern these effects.
Read MoreRead Next
MATERIALS: Analysis Gone Wrong
A lot of resources are devoted each year to trying to figure out why products fail. Sometimes it’s because no one involved in a project realizes the data provided was wrong.
Read MoreMATERIALS: Analysis Gone Wrong
A lot of resources are devoted each year to trying to figure out why products fail. Sometimes it’s because no one involved in a project realizes the data provided was wrong.
Read MoreHow Polymer Melts in Single-Screw Extruders
Understanding how polymer melts in a single-screw extruder could help you optimize your screw design to eliminate defect-causing solid polymer fragments.
Read More.jpg;width=70;height=70;mode=crop)
