
More Growth & Equipment Investment For Processors This Year
Capital Equipment Forecast
Gardner’s research projects that processors will invest around $3.3 billion in primary machinery, auxiliary equipment, and molds and related supplies this year, about 10% more than its projection for 2013.
.JPG;width=70;height=70;mode=crop;format=webp)
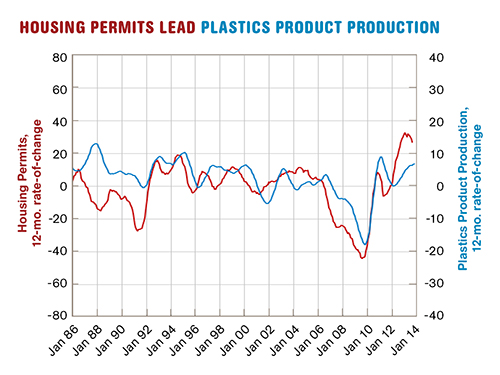
FIG. 1 Housing permits are growing at their fastest rate in 30 years. Even though the growth rate is slowing, it is strong enough that plastics parts production could continue to grow faster in 2014.
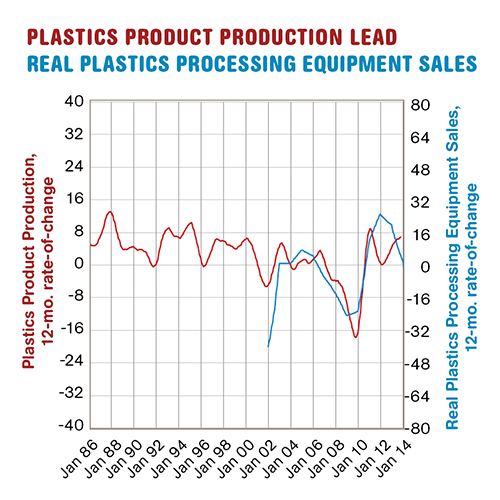
FIG. 2 The trend in industrial production indicates that our survey respondents are too pessimistic regarding their 2014 capital spending plans. Expect equipment sales to be up 5-10% based on this chart.
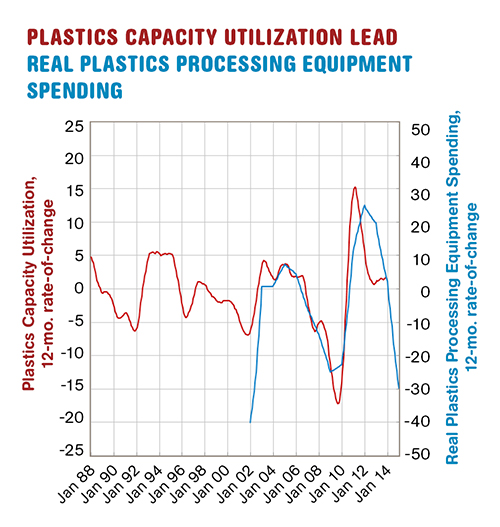
FIG. 3 Capacity utilization is the best leading indicator of capital equipment spending. The trend in capacity utilization is pointing to a moderate increase in primary processing equipment sales in 2014.
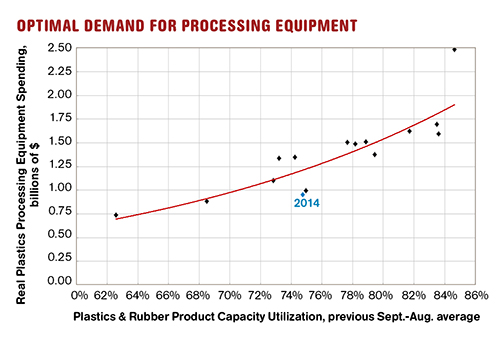
FIG. 4 The red line represents optimal plastics processing equipment demand. The industry typically overbuys or underbuys optimum demand in four- to seven-year cycles. 2014 should represent the sixth year of overbuying, except that our survey respondents were likely too pessimistic.


Growing plastic part production and higher capacity utilization rates should have a two-pronged effect that will require processors to invest in more new capital equipment this year, according to a recent survey and research conducted by Gardner Business Media, the Cincinnati-based parent company of Plastics Technology magazine. Gardner’s research projects that processors will invest around $3.3 billion in primary machinery, auxiliary equipment, and molds and related supplies this year, about 10% more than its projection for 2013.
Since the financial collapse in late 2008, manufacturing has been one of the strongest, if not the strongest, sectors of the U.S. economy. Industrial production of durable goods has more than recovered since the lows in the summer of 2009. According to this index, the U.S. is producing more durable goods today than ever. Every month in 2013 the durable-goods production index set a record high for that month.


In addition to the highest-ever production levels, durable-goods capacity utilization continues to climb higher. During the worst of the recession, capacity utilization fell to nearly 60%. Today, utilization is approaching 77%. Based on at least one leading indicator, capacity utilization will continue to rise in 2014.
Reshoring has been a primary driver in the recovery of U.S. manufacturing. Manufacturing is returning to the U.S. because of more competitive labor costs, higher-quality production, shorter lead times, increased shipping costs, threats to intellectual property, and more. The reshoring phenomenon has led to higher levels of production and capacity utilization at plastics-processing facilities in addition to general durable-goods manufacturing.
Of course, spending on capital equipment is largely driven by the trends in industrial production and capacity utilization. Against this backdrop, this past August Gardner sent out 18,000 surveys to subscribers of Plastics Technology and sister publication Moldmaking Technology magazine, asking them about their spending plans for primary processing equipment, auxiliary equipment, molds, software, and testing equipment in 2014. More than 700 replied. Based on these responses, Gardner forecasts spending by equipment type, industry, plant size, and region of the country.
The results of this year’s survey were much more pessimistic than expected, given the trends in the leading indicators, especially in the area of primary machinery. One possible reason for respondents’ pessimism is they were filling out the survey while federal budget negotiations were heating up. According to the survey, plastics processors will spend $954 million on new injection molding machinery, extruders, and so forth, which would be almost 30% lower than our estimate for 2013; and $1.058 million on auxiliary equipment, which would be down 13% from our estimate for 2013. But based on the leading indicators, it’s more likely that both primary processing and auxiliary equipment sales will be flat at worst, and more likely will be up 5-10%, in 2014.
Spending on molds and mold-related supplies is projected to be $989 million in 2014, an increase of more than 60%. This is a dramatic bump in mold consumption, which is driving a significant increase in investment for mold manufacturing.
EARLY LEADING INDICATORS
Gardner tracks a series of leading indicators to get a feel for where the plastics industry is headed. The earliest leading indicator is the Federal funds rate, which is the overnight lending rate between banks set by the Federal Reserve. This rate is important because it influences the direction of all interest rates, including rates for cars and houses.
The Fed funds rate has been essentially zero since December 2008. In this zero-interest-rate environment, the real Fed funds rate is more important than the nominal Fed funds rate. The real Fed funds rate is simply the Fed funds rate minus inflation. Even though nominal rates cannot go below zero, the Federal Reserve can push real rates below zero if price inflation is greater than the interest rate. Since March 2010, the Federal Reserve has been able to do just that, as the real Fed funds rate has been negative.
Negative interest rates encourage consumers to increase their spending on goods that are purchased primarily with debt, like houses, cars, and other durable goods. However, more important than the rate itself is the direction that rates are moving. As rates fall, consumers typically spend more on houses and cars, and vice versa. In the second half of 2013, the real Fed funds rate was increasing at a slower rate than a year ago (as shown by the red line moving upward on the chart). This would indicate that spending on houses and durable goods should increase in 2014.
For the plastics industry, Gardner uses the real Fed funds rate as a leading indicator for housing permits. Housing permits are an indicator of how much new home construction there will be. And, of course, new homes have a lot of plastics in them, whether it is from the actual home’s construction, appliances, electronics, furnishings, etc. The actual level of housing permits is still quite low. In fact, the current level of housing permits is barely above prior recessionary levels. But, growth in housing permits was accelerating throughout 2012. As the Fed funds rate began rising year over year, the growth rate in housing permits started to decelerate in late 2012 and early 2013. But, as I mentioned above, the trend in the real Fed funds rate indicates that housing permits should start to grow faster again in the second half of 2014.
Housing permits are an excellent leading indicator for plastics parts production (see Fig. 1). While still below the highs from the 2000s, plastic parts production has jumped over 25% since its low in 2009. Plastics parts production, except for the period from late 2010 to early 2011, is growing at its fastest rate since the mid-1990s. Given the very strong growth in housing permits, it is possible for industrial production of plastics parts to continue growing faster in 2014.
The best leading indicators for capital spending in the plastics industry are industrial production and capacity utilization. Figure 2 compares the rate of change in plastics product industrial production to primary plastics processing equipment sales. The chart shows that industrial production tends to lead capital equipment spending by 12 to 24 months. The slower rate of growth in production in 2011 led to a slower rate of growth in capital equipment spending in 2012 and 2013.
But, here is the first sign why Gardner believes the respondents to its capital spending survey are too pessimistic. With plastic parts production growing faster and faster throughout 2012 and 2013, capital spending on plastics processing equipment should be growing faster in 2014. However, our survey data indicates that capital spending will contract in 2014. Based on this chart, I think it is more likely that primary processing equipment sales will grow 5-10% in 2014.
Gardner often uses industrial production as a leading indicator of capital spending in the plastics industry because it is easier to find leading indicators for it than for capacity utilization. But capacity utilization is the best leading indicator of capital equipment spending. Figure 3 shows that the growth rate in capacity utilization has been more tepid than the growth rate in plastic parts production. The trend in capacity utilization is why I think primary processing equipment will be up just 5-10% instead of the 10-20% that the trend in industrial production indicates. When capacity utilization is growing it is very rare to have contracting capital-equipment spending. This is a good indication that our survey respondents were too pessimistic.
It is also helpful to plot capacity utilization against primary processing equipment sales to create a demand curve. In Fig. 4, the capacity utilization number is the average from September to August of the previous year, because capacity utilization tends to lead primary processing equipment spending by six month to a year. Current average capacity utilization, which will impact 2014 capital spending, is 76.5%. And according to the Gardner survey, primary processing equipment spending will be just under $1 billion in 2014. The red line on the chart represents the optimal demand of equipment sales for any capacity utilization.
The chart makes it clear that equipment sales are rarely at the optimal level. This is because plastics processing facilities cannot buy fractions of a machine. Also, processors tend to buy more equipment than they need, and then grow their way into that capacity. So, plastics processing facilities always are either overbuying or underbuying the market. On this chart, when points fall above the optimal line they represent overbuying, and when they fall below the line they represent underbuying. Careful study of the chart shows that years tend group themselves above or below the line for four to seven years.
The industry will have overbought plastic processing equipment for the last five years. The Gardner survey indicates that 2014 would be the first year in an underbuying cycle. However, given the strong growth in industrial production and moderate growth in capacity utilization, 2014 looks more like another year of overbuying. Therefore, primary processing equipment spending alone would have to be at least $1.25 billion in 2014.
Understanding data and investment trends can help make processors more informed buyers. It will also give processors insight into what others are doing that you might consider, such as investing more in all-electric molding presses. Finally, having an understanding of the investment trends can help processors plan strategically and identify potential growth markets to pursue for new business.


Related Content

How to Configure Your Twin-Screw Extruder: Part 3
The melting mechanism in a twin-screw extruder is quite different from that of a single screw. Design of the melting section affects how the material is melted, as well as melt temperature and quality.
Read More
How to Maintain Pelletizing Quality When Acid Attacks
Developments in the chemistry of polymers and additives have made corrosion a real problem in pelletizers. Here’s how to ward it off.
Read More
Configuring the Twin Screw Extruder: Part 4
For many compounding operations, material is fed to the extruder at the feed throat. This is the case when feeding a single polymer or a blend of polymers mixed with solid additives. Some ingredients, however, present a challenge in feeding. Here’s how to solve to them.
Read More
What to Know About Your Materials When Choosing a Feeder
Feeder performance is crucial to operating extrusion and compounding lines. And consistent, reliable feeding depends in large part on selecting a feeder compatible with the materials and additives you intend to process. Follow these tips to analyze your feeder requirements.
Read MoreRead Next

Lead the Conversation, Change the Conversation
Coverage of single-use plastics can be both misleading and demoralizing. Here are 10 tips for changing the perception of the plastics industry at your company and in your community.
Read More
Understanding Melting in Single-Screw Extruders
You can better visualize the melting process by “flipping” the observation point so that the barrel appears to be turning clockwise around a stationary screw.
Read More
Troubleshooting Screw and Barrel Wear in Extrusion
Extruder screws and barrels will wear over time. If you are seeing a reduction in specific rate and higher discharge temperatures, wear is the likely culprit.
Read More