What’s Your Process Energy Fingerprint?
As we discussed in last month’s column, your plant’s “energy fingerprint” is composed of the base load and the process load.
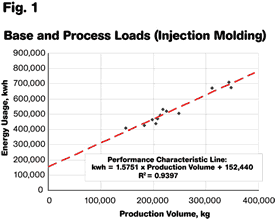
As we discussed in last month’s column, your plant’s “energy fingerprint” is composed of the base load and the process load. The first is fixed and the second is variable (analogous to fixed and variable costs). The base load is the fixed “energy overhead,” which is consumed even if no production is taking place, and it does not change with the production level of the plant. The process load is variable in proportion to the production level. As we showed last month, a scatter chart of energy consumption (in kwh) versus production volume (in lb or kg) will yield a straight-line curve of the process load, known as the Performance Characteristic Line (PCL). At zero production, the PCL intersects the vertical axis (energy usage) at the height of the base load (see Fig. 1).
The method for finding the PCL for your plant can be used for any process where the main driver for energy usage is volume-related and energy is supplied from a single fuel source, such as electricity. However, the height and slope of the PCL are highly process-dependent, because different processes have different process loads.
For a typical plant, the base load should lie in the range of 10% to 40% of the average total load. Exceptional plants can get the base load down to 3% of the total load, and a base load higher than 30% of the average total load indicates poor control of energy usage and should be investigated. When reasonable efforts are made to control the base load—i.e., it is in the region of 15% to 30% of the average total load—then the process load (the slope of the PCL) will indicate the overall energy efficiency of the underlying process. This will vary with the basic energy intensity of the process but it is possible to estimate typical values for individual processes.
INJECTION MOLDING
A typical injection molding plant (Fig. 1) will have a process load in the region of 0.9 to 1.6 kwh/kg (0.4-0.73 kwh/lb). This will vary with the size of the base load—i.e., a high base load as a proportion of the total load will generally result in a lower apparent process load. Any site with values that are very different needs to investigate the causes.
EXTRUSION
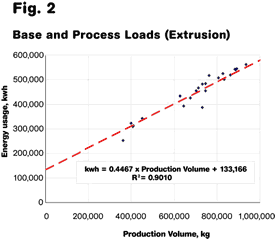
As would be expected, extrusion has a lower process energy requirement than injection molding. A typical extrusion plant will have a process load in the region of 0.4 to 0.6 kwh/kg (0.18-0.27 kwh/lb). Typical industry data for profile extrusion (Fig. 2) shows a base load of 30% of the average total energy use and a process load of 0.4487 kwh/kg (0.204 kwh/lb) of plastic processed.
The injection molding plant and the profile extrusion plant have broadly similar base loads (both in magnitude and in percentage terms) but the extrusion site has a process load only 30% of that of the injection molding site (0.4467 kwh/kg versus 1.5751 kwh/kg). Film and fiber extrusion operations are slightly less energy-intensive than profile extrusion and their process loads are also lower.
EXTRUSION BLOW MOLDING
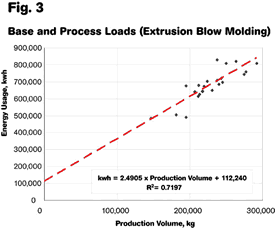
Extrusion blow molding has a higher process energy load than extrusion and a typical site will generally have a process load in the region of 1.4 to 2.5 kwh/kg (0.64-1.14 kwh/lb). Typical industry data for extrusion blow molding (Fig. 3) shows a base load of 17% of the average total energy use and a process load of 2.4905 kwh/kg of plastic processed. This is a high process load value but when the base load is in the region of 30% then the process load decreases to around 1.5 kWh/kg.
EXTRUSION & THERMOFORMING
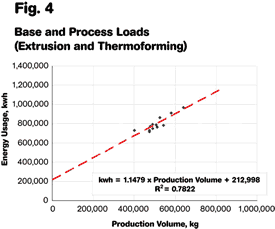
Extrusion and subsequent thermoforming naturally have a higher process energy load than extrusion alone, and a typical site will generally have a process load in the region of 0.9 to 1.6 kwh/kg (0.4-0.73 kwh/lb), about the same as for injection molding. Typical industry data for extrusion and subsequent thermoforming (Fig. 4) shows a base load of 30% of the average total energy use and a process load of 1.1479 kwh/kg (0.522 kwh/lb) of plastic processed. The process load will change slightly depending in the exact process—extrusion and later thermoforming or extrusion with in-line thermoforming.
MIXED PROCESSES
Where plants have a mixture of processes, such as injection molding and extrusion, it is not always possible to separate the energy usage for each process. In these cases, the energy-usage and production-volume data will show more scatter because of variations in the monthly product mix.
The equation of the PCL for a mixed-process plant will be of the form:
kwh = A x PV1 + B x PV2 + Base Load1+2.
(PV1 is production volume for Process 1; PV2 is production volume for Process 2; and Base Load1+2 is the overall plant base load.)
It is possible to use multi–variate analysis to separate the individual processes from the combined data, but direct sub-metering of the individual processes is much easier and more direct. Electrical sub-metering gives direct data on energy usage and is more appropriate than a sophisticated analytical tool.
MIXED FUELS
Some processes, such as rotational molding and EPS foam production, use more than one energy source. In these cases the PCL can be found not only for the electricity usage but also for the gas usage. Both energy sources can be linked to production volume and a PCL can be found for each energy source.
By expressing gas and electricity in energy equivalents, the two energy sources can be combined to give total energy use, and a total PCL can be developed. But splitting the data according to the energy source provides better guidance on how to target actions to reduce energy usage.
USING THE PCL
Finding the PCL for a site is not simply an academic exercise; it starts the process of benchmarking and allows a site to see where it is going and the areas it needs to concentrate on to achieve the quickest savings. It also allows a site to set performance targets and monitor achievements.
About the Author
Dr Robin Kent is founder and managing director of Tangram Technology Ltd. in Hitchin, Herts., U.K. Tangram provides consulting engineering, training, and design services to plastics processors. Kent has been involved in injection molding and extrusion for 36 years and has worked as technical director for several major plastics processing companies in the U.K. and Europe. He can be reached at rkent@tangram.co.uk or visit www.tangram.co.uk. Articles in this series are adapted from his book, Energy Management in Plastics Processing (2008, 265 pages, www.pidbooks.com).
Related Content
Put Some ‘Lean’ into Your Profile Extrusion Process
With everyone struggling to find talent, there are ways to reduce operator interaction with the process by applying some lean manufacturing principles.
Read MoreCrosshead Die Features Single-Point Concentricity Adjustment
One adjustment bolt controls 360° of adjustment.
Read MoreHow to Select the Right Tooling for Pipe Extrusion
In pipe extrusion, selecting or building a complementary set of tooling often poses challenges due to a range of qualitative factors. Here’s some guidance to help you out.
Read MoreFully Automated Extrusion Process Enables Use of Composites for Manufacturing Pressure Tanks
Amtrol was looking for a more cost-effective means to produce thin-wall liners for a new line of pressure tanks. With the help of a team of suppliers, they built one of the world’s most sophisticated extrusion lines.
Read MoreRead Next
Lead the Conversation, Change the Conversation
Coverage of single-use plastics can be both misleading and demoralizing. Here are 10 tips for changing the perception of the plastics industry at your company and in your community.
Read MorePeople 4.0 – How to Get Buy-In from Your Staff for Industry 4.0 Systems
Implementing a production monitoring system as the foundation of a ‘smart factory’ is about integrating people with new technology as much as it is about integrating machines and computers. Here are tips from a company that has gone through the process.
Read MoreWhy (and What) You Need to Dry
Other than polyolefins, almost every other polymer exhibits some level of polarity and therefore can absorb a certain amount of moisture from the atmosphere. Here’s a look at some of these materials, and what needs to be done to dry them.
Read More.png;maxWidth=970;quality=90)








.png;maxWidth=300;quality=90)







.png;maxWidth=970;quality=90)