
MATERIALS: The Problems with Single-Point Data
Properties are generally provided at a single temperature on a data sheet. But do those properties stay the same with changing temperatures? Of course not.
.jpg;width=70;height=70;mode=crop;format=webp)
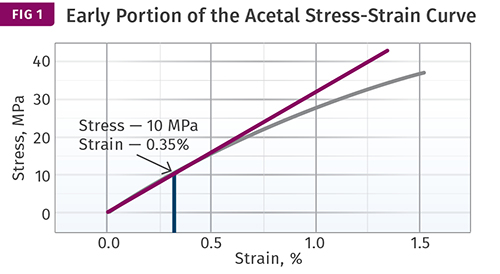
This shows the initial portion of a tensile stress-strain curve that identifies the proportional limit. This is the last point on the curve where the stress and strain are in proportion. Beyond that the initial straight line becomes a curve that exhibits an ever-decreasing slope, which finally results in the yield point.
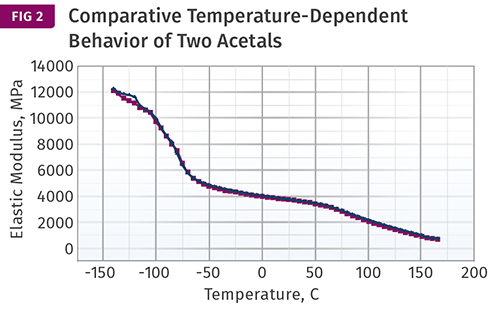
These are plots of elastic modulus as a function of temperature for two similar grades of acetal copolymer. While the elastic modulus and the tensile modulus are not exactly equivalent, they typically agree within 1% of each other and therefore can be used interchangeably in determining fitness for use in an application.
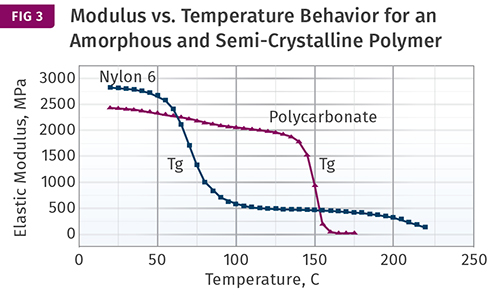
In both amorphous PC and semi-crystalline nylon 6, there is a region of rapid change in performance related to the glass transition.

Historians who chronicle the events associated with the establishment and development of the plastics industry point to the invention of nitrocellulose by John Wesley Hyatt as the seminal point from which the industry grew. Hyatt also developed the first machine designed to mold these materials. This puts the age of the industry at nearly 150 years.
Rapid development of synthetic materials began in the 1930s with the development of polyethylene, polyester, and nylon, and exploded after World War II. From the late 1940s to the early 1980s, almost all of the polymer families that populate our industry were invented and developed into commercial product lines. At the same time, the fundamental underpinnings of polymer chemistry and physics were being developed, providing for a better understanding of the mechanisms that drive the performance of these materials and enabling their effective use.


Having reached something of a development plateau with the creation of materials whose properties can compete with metals and ceramics, it would be a logical next step to produce information on polymer performance that would go beyond the summary information that was originally codified into the data sheet. While there have been various efforts to provide such an expanded view, the industry still relies mainly on one- to four-page documents full of single-point data. These are supposed to provide the processor and the end user with the information needed to make sound decisions regarding material selection and the establishment of processing conditions.
When we look at the property section of these data sheets, we find that, for the most part, the properties that are provided are given at a single temperature, 73 F (23 C). When I give seminars on material properties, I typically ask the groups whether anyone believes that these properties remain constant with changing temperature. No one ever raises their hand. Despite the paucity of information regarding the effects of temperature on the performance of plastic materials, we all seem to have an instinct regarding the variability of properties with temperature. This raises the next logical question: If we know that properties change with temperature, and we expect that we can use these materials across a wide range of temperatures, why would we tolerate an industry that is only willing to tell us about properties at a single temperature?
Let’s start with a single property that appears on virtually every data sheet: modulus. Modulus is defined as the ratio of stress divided by strain and is therefore a measure of what we often refer to as stiffness. If a stress is applied and the result is a large amount of deformation, then the material is considered to be of a low modulus and we call it flexible. Low-density polyethylene would be an example of this class of materials. If the same stress results in very little deformation, such as occurs in a 40% glass-fiber-reinforced nylon or PPS, we think of these materials as very stiff and we state this fact quantitatively as a high modulus. Modulus can be measured in any number of ways—in tension, flexure, compression, shear, etc.—but in all cases we are capturing a relationship that characterizes a quantitative response to an applied stress.
Because polymers exhibit nonlinear behavior at high stress levels, it is important to understand that the modulus refers only to the stress-strain relationship at relatively small strains. Figure 1 shows the initial portion of a tensile stress-strain curve that identifies the proportional limit. This is the last point on the stress-strain curve where the stress and strain are in proportion. Beyond this point the initial straight line becomes a curve that exhibits an ever-decreasing slope, which finally results in the yield point.
While yield strains are frequently in the range of 5-10%, proportional limits rarely exceed 0.5%. In this case the proportional limit gives a stress of 10 MPa (1450 psi) at a strain of 0.35%, producing a modulus in tension of 2855 MPa (414,000 psi).
But what happens as temperature changes? For this specific material, an acetal copolymer, the answer is shown in Fig. 2. These are plots of elastic modulus as a function of temperature for two similar grades. While the elastic modulus and the tensile modulus are not exactly equivalent, they typically agree within 1% of each other and therefore can be used interchangeably in the types of calculations that would be performed in determining fitness for use in an application.
The curves in Fig. 2 show behavior across a wide temperature range that begins at sub-ambient conditions and extends to near the melting point of the polymer. It can be seen that there are regions of these curves where properties are changing rapidly and areas where the change is gradual and appears to be almost linear with temperature. But the point is that the property does change, and it does so in a way that is not straightforward. In all plastic materials the plot of modulus versus temperature consists of regions of relative stability punctuated by sudden and significant changes in performance.
There is no easy “rule of thumb” that can correlate this property with temperature. Figure 3 shows a comparison of polycarbonate, an amorphous material, and nylon 6, a semi-crystalline material. In both cases there is a region of rapid change in performance related to an important property called the glass transition. In amorphous polymers the glass transition results in an almost complete loss of load-bearing properties. In a semi-crystalline material the decline is significant but not catastrophic, and semi-crystalline materials can be used above their glass-transition temperature provided that we factor in the reduction in performance exhibited by the curve.
But where do we find this information? Certainly not on the data sheet. Even if a material supplier gives the property at multiple temperatures, there are still not enough points to intuit the shape of the curve. The regrettable reality is that we have had the technology to generate the curves in Figs. 2 and 3 for over 30 years and some material suppliers have done this work.
But much more needs to be done and greater efforts are needed to make the data that does exist more accessible and easier to understand and use. So we have the unfortunate situation of engineers performing finite-element analysis using property values that have nothing to do with their application conditions. To say that it is time for a change would be a gross understatement.
Editor’s note: You can read the next part in the series by clicking here.


Related Content

Resin Prices Still Dropping
This downward trajectory is expected to continue, primarily due to slowed demand, lower feedstock costs and adequate-to-ample supplies.
Read More
The Effects of Stress on Polymers
Previously we have discussed the effects of temperature and time on the long-term behavior of polymers. Now let's take a look at stress.
Read More
New Entrant Heartland Polymers Stepping up as Reliable Supplier
Heartland Polymers’ new Alberta, Canada facility will produce 525 KTA propylene and 525 KTA polypropylene. It is expected to stabilize supply chains across the continent.
Read More
Prices for All Volume Resins Head Down at End of 2023
Flat-to-downward trajectory for at least this month.
Read MoreRead Next

Why (and What) You Need to Dry
Other than polyolefins, almost every other polymer exhibits some level of polarity and therefore can absorb a certain amount of moisture from the atmosphere. Here’s a look at some of these materials, and what needs to be done to dry them.
Read More
Understanding Melting in Single-Screw Extruders
You can better visualize the melting process by “flipping” the observation point so that the barrel appears to be turning clockwise around a stationary screw.
Read More