MATERIALS: The Problems With Single-Point Data
Polymer properties are not constant as a function of temperature, and even small temperature changes can affect properties.
.jpg;width=70;height=70;mode=crop;format=webp)
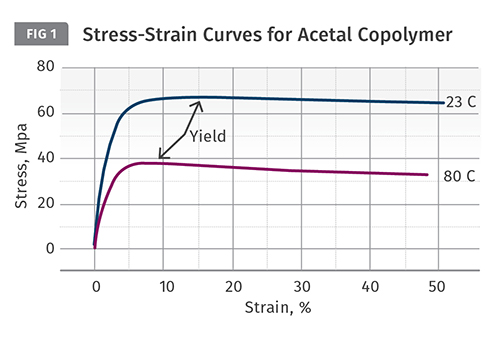
A comparison of tensile stress-strain behavior for an acetal copolymer at room temperature and 80 C shows that even the individual data points placed on the data sheets are significantly influenced by this increase in temperature.
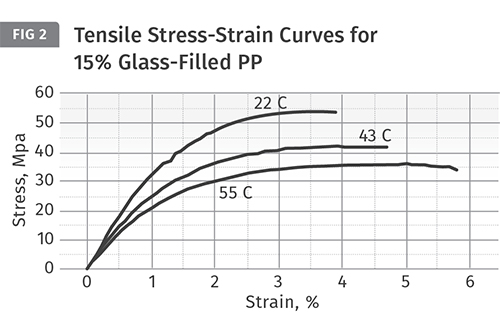
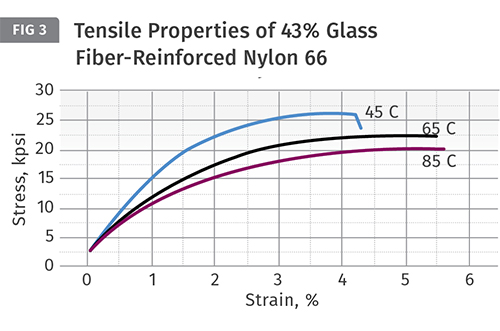
In these examples above and below the temperature increases are relatively small and well within the temperature range where these polymers can be expected to perform. But clearly these changes in temperature produce significant changes in properties despite the presence of the glass fiber.
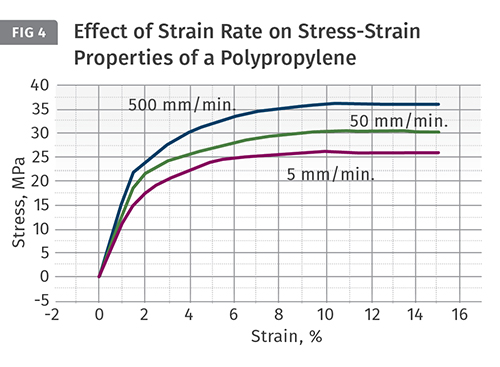
Here an unfilled polypropylene has been characterized at room temperature using three different crosshead speeds. Even though the temperature of the tests is constant, the change in crosshead speed produces results that look as though the tests were performed at different temperatures.

Last month we illustrated the value of the tensile stress-strain curve as compared with having a data sheet that only provides the coordinates for one or two points on that curve. This same principle applies to stress-strain curves generated in other modes, such as flex and compression.
But we limited our discussion to curves generated at room temperature. It is important that we understand that the properties of polymers are not constant as a function of temperature and that relatively small changes in temperature can result in significant changes in mechanical properties. With properties such as strength and modulus, the primary concern is with the effects of increasing temperature since this is the direction in which we can expect these properties to decline.


We can select any polymer to illustrate this effect. Figure 1 shows a comparison of tensile stress-strain behavior for an acetal copolymer at room temperature and 80 C. It is apparent from these graphs that even the individual data points placed on the data sheets are significantly influenced by this increase in temperature. The yield strength and modulus of the material are both reduced by approximately 40% and the yield strain also changes. While it is not shown, if we were to illustrate the complete curve all the way out to the point of failure, we would also see that the elongation to failure will increase with rising temperature. This is all consistent with what we know about the behavior of polymers; increasing temperature reduces load-bearing properties such as strength and stiffness while improving ductility, which is captured by properties such as impact resistance and elongation at break. The problem with our current methods of presenting material properties is that we do not quantify these changes for the designers and engineers responsible for selecting materials.
There is the impression among some that adding inorganic fillers and reinforcements such as glass fiber eliminates this temperature-dependent response. Figure 2 shows tensile-stress strain curves at multiple temperatures for a 15% glass fiber-reinforced polypropylene and Fig. 3 gives similar data for a nylon 66 with the much higher level of reinforcement of 43%. In both cases the illustrated temperature increases are relatively small and well within the temperature range where these polymers can be expected to perform. But it is very evident that these changes in temperature produce significant changes in properties despite the presence of the glass fiber.
Even if data sheets were to begin to publish the traditional markers on the curve associated with yield and ultimate stress and strain, it is quite clear that this still provides little guidance to design engineers when compared with access to the complete curve or the file containing the associated table of x-y coordinates. Changes in temperature do more than just alter the numbers we have become accustomed to looking at, they change the fundamental shape of the curves.
There is a related point that needs to be made regarding another variable associated with testing tensile properties of polymers. This is illustrated in Fig. 4. In this graph an unfilled polypropylene has been characterized at room temperature using three different crosshead speeds. Even though the temperature of the tests is constant, the change in crosshead speed produces results that look as though the tests were performed at different temperatures. The fastest crosshead speed produces a stress-strain curve that corresponds to a low test temperature while the slower crosshead speeds resemble the effects of higher temperatures. This illustrates the strain-rate dependence of polymers and shows that changing the strain rate of the test and the temperature of the test have equivalent effects.
This equivalence of temperature and strain rate is an underlying principle of viscoelasticity that has a practical significance. When materials are tested for the purpose of publishing mechanical properties, the tests on all materials must be conducted under the same conditions. This is a detail that is often missed in this era of electronic databases that allow for a quick creation of side-by-side comparisons. Often a non-critical examination of the numerical values for a given property can lead to the conclusion that one material is superior to another when the published differences are simply an artifact of different test methods.
I remember having a conversation years ago with a technical representative from a company that sold a material that was a direct competitor to a compound that we were molding in significant volumes. The data sheet for the incumbent material listed a tensile yield strength of 8800 psi and the alternate material gave a value of 9430 psi. When I asked about the reason for the difference I received an elaborate narrative about the fact that the new material was formulated in a special way that resulted in a more crystalline structure. It sounded good, but an analysis of the two materials showed that it was all nonsense.
The essential difference was based on the fact that the material we were molding had been tested at a crosshead speed of 0.2 in./min, and the new material used a crosshead speed of 2 in./min. There is a general rule of thumb that an order of magnitude increase in the crosshead speed of the tensile test will increase the yield strength of a material by approximately 7%. This was almost exactly the change we observed. This was a good lesson in separating the fact from the myth. But these pitfalls are everywhere in today’s published data, and the problem has become more acute now that we are listing test results using different test standards such as ASTM and ISO on the same data sheet.
Next month we will take a look at impact properties.
ABOUT THE AUTHOR Mike Sepe is an independent, global materials and processing consultant whose company, Michael P. Sepe, LLC, is based in Sedona, Ariz. He has more than 35 years of experience in the plastics industry and assists clients with material selection, designing for manufacturability, process optimization, troubleshooting, and failure analysis. Contact: (928) 203-0408 • mike@thematerialanalyst.com.
Related Content

Understanding Strain-Rate Sensitivity In Polymers
Material behavior is fundamentally determined by the equivalence of time and temperature. But that principle tends to be lost on processors and designers. Here’s some guidance.
Read More
Understanding the ‘Science’ of Color
And as with all sciences, there are fundamentals that must be considered to do color right. Here’s a helpful start.
Read More
The Effects of Time on Polymers
Last month we briefly discussed the influence of temperature on the mechanical properties of polymers and reviewed some of the structural considerations that govern these effects.
Read More
Prices for All Volume Resins Head Down at End of 2023
Flat-to-downward trajectory for at least this month.
Read MoreRead Next

MATERIALS: The Problems with Single-Point Data
Engineers who are used to working with metals are surprised that plastics cannot operate as close to their yield points as can metals. The yield point is not enough to tell you how the material reacts to stress.
Read More
MATERIALS: The Problems with Single-Point Data
Engineers who are used to working with metals are surprised that plastics cannot operate as close to their yield points as can metals. The yield point is not enough to tell you how the material reacts to stress.
Read More
MATERIALS: The Problems with Single-Point Data
Engineers who are used to working with metals are surprised that plastics cannot operate as close to their yield points as can metals. The yield point is not enough to tell you how the material reacts to stress.
Read More