MATERIALS: The Problems with Single-Point Data, Part 7
The industry can choose between continuing to perform DTUL tests that provide single points that are part of a curve never seen, or perform the test that provides the entire curve.
.jpg;width=70;height=70;mode=crop;format=webp)
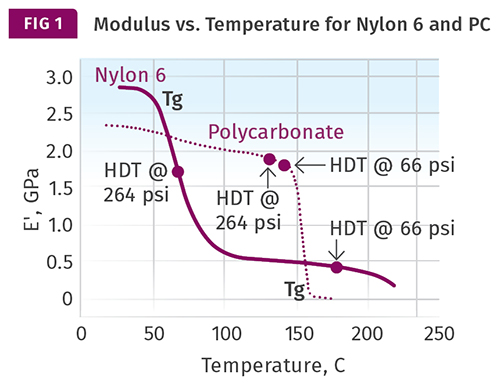
Modulus vs. temperature plots for an unfilled polycarbonate and nylon 6. DTUL values at both 66 psi (0.455 MPa) and 264 psi (1.82 MPa) are noted on the curves.
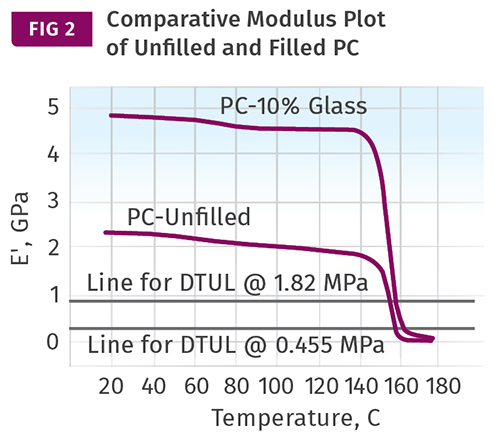
A comparison of the modulus-temperature relationship for an unfilled polycarbonate and a 10% glass-reinforced grade reveals an obvious improvement in modulus in the filled material. But the effects of the glass transition are inescapable and therefore the improvement in the DTUL for the filled material is relatively small.
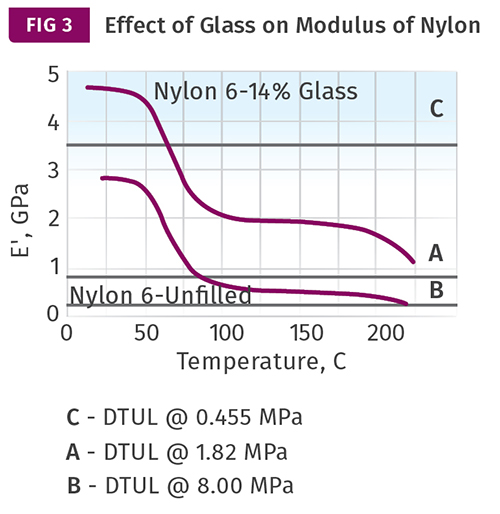
Here, a horizontal line labeled “C” is associated with a third load that is covered in the ISO method but has no counter-part in the ASTM method.


When a deflection temperature under load (DTUL) test is performed, what is actually being measured? In 1978 Dr. Michael Takemori tackled this question in an SPE ANTEC paper. He showed that the DTUL was the temperature at which a particular strain was achieved when a specific stress was applied. Since stress divided by strain is the modulus, DTUL tests essentially determine the temperature at which a material reaches a particular modulus.
By working through the calculations involving the geometry of the ASTM test specimen and the applied stresses of 66 psi (0.455 MPa) and 264 psi (1.82 MPa), he came up with modulus values that he expressed as 108.3 Pa for the 0.455 MPa stress and 108.9 Pa for the 1.82 MPa stress. These translate to just under 200 MPa and 800 MPa, respectively, or 29 kpsi and 116 kpsi.


The question is, do these arbitrary values assist anyone in making a decision about the fitness-for-use of a material at elevated temperatures? A further question is, does selecting candidate materials by setting a threshold value for the DTUL and then picking materials from the resulting list have any validity as a material selection strategy?
The best way to assess the utility of DTUL values is to examine them in the context of a complete map of modulus as a function of temperature. Figure 1 shows modulus vs. temperature plots for two unfilled thermoplastics, polycarbonate and nylon 6. The published DTUL values at both 66 psi (0.455 MPa) and 264 psi (1.82 MPa) are noted on the curves.
Polycarbonate is amorphous and is representative of the behavior of this class of thermoplastics. The modulus of amorphous polymers tends to be fairly consistent between room temperature and a point approximately 30° C below the glass-transition temperature (Tg). Above this temperature, the modulus declines rapidly as the polymer enters the glass transition. At the conclusion of the glass transition, the modulus has declined by over two orders of magnitude (more than 99%) relative to the values below the glass transition. For this reason, the DTUL values for polycarbonate and other amorphous polymers are very close together and typically appear on the verge of the rapid decline in modulus associated with the glass transition. Above the glass-transition temperature, amorphous polymers have no useful mechanical properties.
Nylon 6 is semi-crystalline and serves as a model for all semi-crystalline polymers. In semi-crystalline materials, the glass transition does not result in a complete loss of mechanical properties because the crystalline structure maintains some level of performance. Nevertheless, as Fig. 1 shows, the glass transition results in a significant decline in modulus over a relatively narrow temperature range. The magnitude of this decline is related to the degree of crystallinity in the polymer. For unfilled nylon 6, the modulus that remains above the Tg is approximately 20% of the room-temperature modulus. In this particular case, that results in a DTUL at 66 psi that is approximately 50° C below the melting point of the polymer, while the DTUL at 264 psi is nearly at the midpoint of the glass transition. Since the melting point and the Tg of a semi-crystalline polymer are 150-200o C apart, these DTUL values are also widely separated.
But because the Tg of semi-crystalline polymers can vary greatly, this generalization is not as reliable as the one we observe for amorphous polymers. Therefore, knowing the DTUL of semi-crystalline polymers at the two commonly employed stress levels cannot be used to deduce the broader pattern of temperature- dependent behavior. There is simply no substitute for having access to the complete curves, as shown in Fig. 1.
If we rely only on DTUL values, the effect of adding fillers or reinforcements has an apparent effect that masks what really happens. In amorphous materials the effect on the DTUL is minimal, while in semi-crystalline materials it appears to be much more significant. Adding fillers and reinforcements increases the modulus at any particular temperature, but it does not change the Tg or the melting point of a polymer. Figure 2 shows a comparison of the modulus-temperature relationship for an unfilled polycarbonate and a 10% glass-fiber reinforced grade. The improvement in modulus in the filled material is apparent. But the effects of the glass transition are inescapable, and therefore the improvement in the DTUL for the filled material is relatively small. The horizontal lines represent the modulus values that Takemori calculated for the 264 psi (1.82 MPa) and 66 psi (0.455 MPa) DTUL tests, respectively.
Figure 3 shows the same effect of adding a low level of glass fiber to the nylon 6. In this case, the addition of the glass raises the modulus profile of the material high enough that the critical modulus values for the two stress levels employed in the ASTM version of the test are not reached until the material is close to the melting point. This results in DTUL values that increase dramatically. But this increase is simply a result of the effect of the reinforcement on the modulus of the material relative to the arbitrary values associated with the DTUL test. The letters “A” and “B” refer to designations assigned to these stress levels in the ISO version of the test.
Note that Fig. 3 shows a horizontal line labeled “C.” This line is associated with a third load that is covered in the ISO method but has no counterpart in the ASTM method. It calls for a stress of 1160 psi (8 MPa), significantly higher than either of the stresses used in the ASTM test. As a result, the modulus that is related to this stress is significantly higher: 3520 MPa (510.4 kpsi). With a higher stress and the higher associated modulus, the measured DTUL will be lower. In this case, it would be reported for the glass-filled nylon 6 at approximately 70 C. This is quite a change from the typical values of more than 200 C that we are accustomed to seeing for this type of material when tested at a stress level of 264 psi. Since most people tasked with material selection use the data sheet as their primary decision-making tool, it is no wonder that material suppliers are not rushing to test their materials using this higher stress included in the ISO protocol.
This shows that the values that are derived from the DTUL tests are simply horizontal lines drawn from the appropriate modulus to a point where that line intersects the modulus-temperature curve. So as an industry we have a choice. We can continue to perform DTUL tests that provide us with single points that are part of a curve we never see, or we can perform the test that provides the entire curve. It may be surprising to many that it actually takes less time to produce the complete curve than it does to run the DTUL tests for multiple stress levels.
If you have been paying close attention to the details of this discussion, you may have noticed that the modulus values associated with the reported DTUL results found on data sheets often do not agree with those calculated by Takemori. In almost every case, the modulus at which the DTUL is measured is higher than Takemori’s value. There is an important reason for this that makes the DTUL value even less useful than it might be otherwise. We will cover that reason in the next article. We will also discuss some of the other pitfalls associated with relying on DTUL values as an actual metric for elevated-temperature performance of a polymer.
ABOUT THE AUTHOR
Related Content

K 2022: ‘All-in-One’ Bottle Tester Takes Three Measurements at Once
Delta Engineering’s new system performs simultaneous topload, height and both pressure-decay and high-voltage leak testing.
Read More
Tracing the History of Polymeric Materials -- Part 30: Polyurethane
In the world of polymers, polyurethane chemistry is probably the most versatile. This a resulted in a wide range of products made from these materials and given the industry the flexibility to respond to the progressive march of regulatory concerns.
Read More
X-Ray Vision Inside Parts Gets More Affordable for Processors
Shimadzu’s new benchtop x-ray CT scanner provides internal and external metrology and flaw detection at a fraction of the previous cost.
Read More
Oxygen Permeation System Also Tests Relative Humidity
Ametek Mocon expands Ox-Tran 2/28 instrument portfolio
Read MoreRead Next

MATERIALS: Impact Testing: The Problems With Single-Point Data
Knowledge of test conditions and graphical data showing the course of the impact event can help provide engineers and designers with the information they need to make informed choices about material toughness.
Read More
MATERIALS: The Problems with Single-Point Data
Engineers who are used to working with metals are surprised that plastics cannot operate as close to their yield points as can metals. The yield point is not enough to tell you how the material reacts to stress.
Read More
MATERIALS: The Problems with Single-Point Data
In plastics, notched Izod and Charpy test results have been complicated by the way they are reported.
Read More