Materials—Cycle Time: Science vs. Rules of Thumb—Part 3
To properly calculate cycle time, you need to understand how the modulus of a polymer increases as it cools in the mold.
.jpg;width=70;height=70;mode=crop;format=webp)
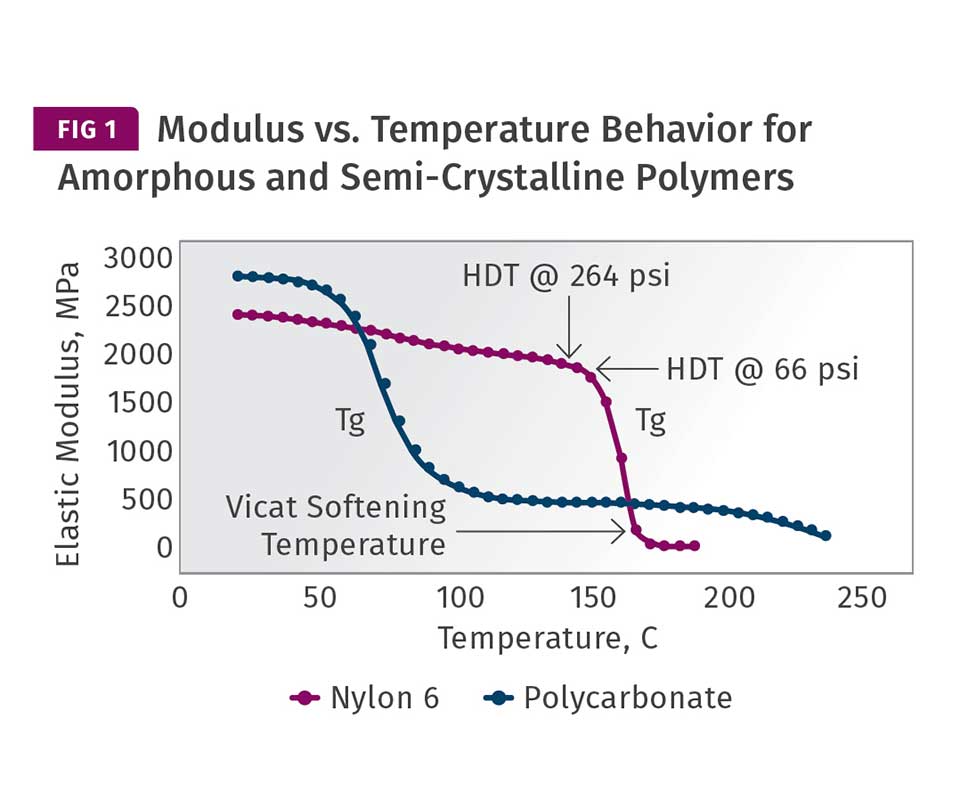
Amorphous polymers and semi-crystalline polymers exhibit differences in temperature-dependent behavior. Here, the elastic modulus of PC, an amorphous material, declines between approximately 140 and 160 C.
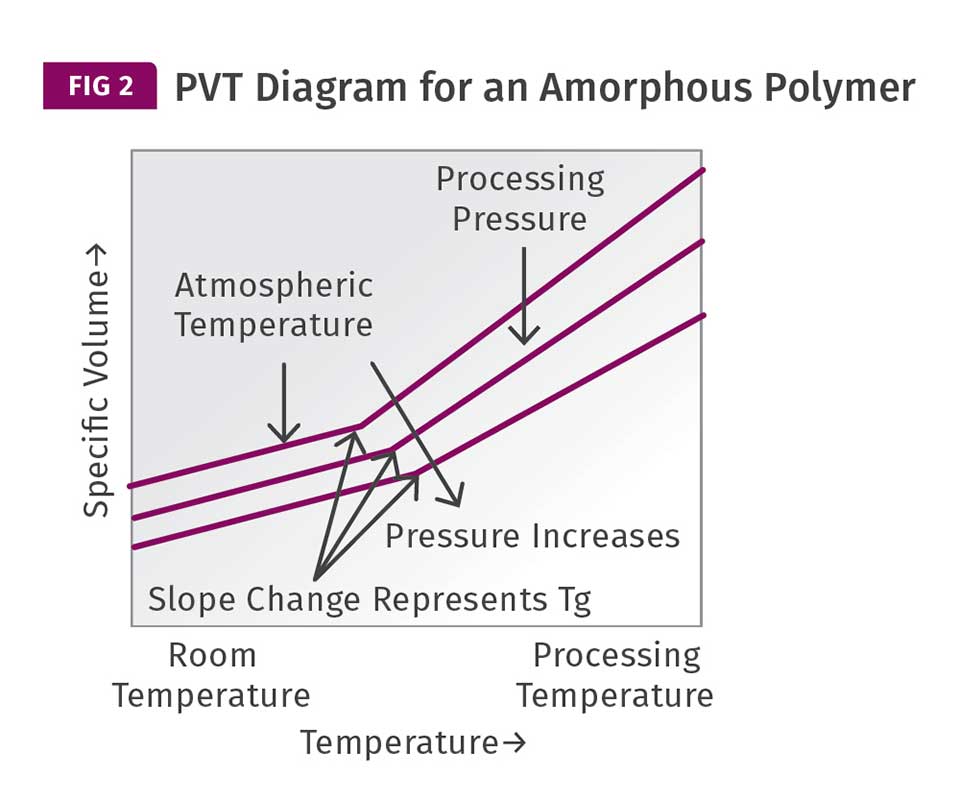
This graph shows the PVT relationship between pressure, temperature, and volumetric change in the polymer. Notice that as the pressure applied to the polymer increases, the glass-transition temperature also increases.


In the last two columns (June and August), we have been discussing the general rules used to calculate cycle times for injection molded parts, with a particular emphasis on how we determine the temperature of the polymer that will allow for ejection of the part without deformation during demolding or subsequent distortion of the part as it cools to room temperature. Many tools reference either the deflection temperature under load (DTUL) or some percentage of that value. A wider survey of literature on the topic even uncovered a reference to the Vicat softening temperature when molding amor- phous polymers, a value that is somewhat higher than the DTUL.
A general lack of understanding of the relationship between modulus and temperature leads to some poor practices when process conditions are established.
To provide for a useful treatment of this topic, the wall thickness of the part must be considered, since this will influence factors such as the rate of heat transfer through the part from the center to exterior surface and from the exterior surface to the mold wall. This, in turn, will influence the actual temperature of the polymer that is supposed to be captured in the term for the ejection temperature (TE). The focus of this article is to obtain an understanding of the how the modulus of a polymer increases as it cools in the mold.


As we illustrated in last month’s column, amorphous polymers and semi-crystalline polymers exhibit differences in temperature-dependent behavior. The big event in the thermal history of an amorphous polymer is the glass transition. If the temperature of an amorphous polymer is increased from room temperature, eventually enough energy is imparted to the material to create independent motion along significant lengths of the individual polymer chains that make up the material. When this occurs, the elastic modulus of the polymer declines rapidly. The plot for PC provided in Fig. 1 shows this event occurring between approximately 140 and 160 C (284 and 320 F). Over this relatively narrow temperature range, the modulus of the material declines by approximately 99%.
As the polymer cools in the mold, the reverse process takes place. The molten material entering the mold begins to build modulus rapidly as it cools through this temperature interval. The layers of flowing material that are in direct contact with the mold will undergo this change at the most rapid rate. Interior layers will cool more slowly, due to their distance from the cavity and core surfaces and the fact that polymers are relatively poor conductors of heat. The temperature of the mold surface will influence the rate of heat transfer, and this will be most noticeable on the part surface. But it is a given that the temperature of the mold must be set below the glass-transition temperature of an amorphous polymer to ensure that the material “sets up.”
The benchmark temperatures that we have been talking about—the Vicat softening temperature and the HDT (or DTUL)—at the two most commonly used stresses of 66 and 264 psi are shown on the modulus curve for the PC. It should be obvious that at the Vicat softening temperature there is little chance that the material will achieve an ejectable modulus. But by the time we reach the HDT values the modulus of the material is approximately 75-80% of what it will be when the material cools to room temperature. Assuming that the innermost layers of the part have reached this temperature, the part has nearly all of the properties it will have when it has cooled completely. One has to wonder then about the previously cited “rule” that the material should be at a temperature that is 80% of its HDT. If we use 135 C (275 F) as our HDT, which is the midpoint between the two values that appear in the graph, and then calculate this 80% value (ignoring for a moment the proper protocol of doing so on the absolute or Kelvin scale, discussed last month), we obtain a value of 108 C (226 F). Over the interval between 135 C and 108 C the modulus has barely changed. So, what is it that we are waiting for?
An aspect of the heat-removal equation that is often neglected is the amount of energy we impart to the material in the barrel.
To return for a moment to the point that all sciences treat temperature using an absolute scale, if this 80% value were calculated properly, the value of 135 C would first be converted to 408 K. Taking 80% of this value would give us 326.4 K or a little over 53 C (127 F). This puts us at a somewhat different point on the scale. However, for PC it makes little difference in terms of the modulus of the polymer. This is part of the problem we have as an industry when we espouse these imprecise rules. We are looking at the wrong axis. The vertical axis that plots modulus is the one we need to pay attention to, not the temperature scale. The effect of temperature on mechanical properties is not linear.
This general lack of understanding of the relationship between modulus and temperature leads to some poor practices when process conditions are established. The recommended mold-temperature range for this polycarbonate is 70-95 C. But it is evident from examining the curve that higher mold temperatures are possible and can be used without any significant penalty in cycle time as long as the wall thickness of the part is accounted for. I have run PC parts with 0.5-in.-thick nominal walls at mold temperatures of 105 C (221 F), and produced parts at the same cycle time as when those parts were run in a mold set at 15 C (59 F). The parts molded at the higher mold temperature looked better, were more dimensionally stable, and contained a lower level of internal stress. This last factor makes the parts more impact resistant and less susceptible to one of the biggest killers of PC parts, environmental stress cracking. When I turned the mold temperature up to 105 C, I was told the material would “never set up.” But a quick look at the modulus plot in Fig. 1 shows that it cannot help but do so.
Another aspect of the heat-removal equation that is often neglected is the amount of energy we impart to the material in the barrel. The person running the cold mold was running a melt temperature of 321 C (610 F). I opted for a much lower melt temperature of 260 C (500 F) and took advantage of a frozen layer that developed much more slowly at the higher mold temperature, allowing the mold to fill with the cooler melt. Two years after the molding date, the parts produced in the cold mold with the hot melt began to spontaneously develop stress cracks that continued to grow larger and more numerous, while the parts produced with the opposite set of conditions continued to perform well.
The other factor that is not considered in the discussion about cycle time is the effect of pressure on the relationship between volume and temperature. Figure 2 shows
a PVT diagram for an amorphous polymer. This shows the relationship between pressure, temperature, and the volumetric change in the polymer. The sudden change in the slope of the specific-volume plots represents the glass transition. Notice that as the pressure applied to the polymer increases, the glass-transition temperature also increases. So, the pressures used during the pack-and-hold phase of the injection process can actually influence the temperature at which this very important transition occurs. Higher pressures should result in a higher glass-transition temperature and therefore an earlier attainment of an ejectable modulus.
An examination of Fig. 1 should make it quite evident that the rules for semi-crystalline polymers are different. In our next installment, we will examine these materials.
ABOUT THE AUTHOR: Mike Sepe is an independent, global materials and processing consultant whose company, Michael P. Sepe, LLC, is based in Sedona, Ariz. He has more than 40 years of experience in the plastics industry and assists clients with material selection, designing for manufacturability, process optimization, troubleshooting, and failure analysis. Contact: (928) 203-0408 • mike@thematerialanalyst.com.
Related Content

Are Your Sprue or Parts Sticking? Here Are Some Solutions
When a sprue or part sticks, the result of trying to unstick it is often more scratches or undercuts, making the problem worse and the fix more costly. Here’s how to set up a proper procedure for this sticky wicket.
Read More
How to Stop Flash
Flashing of a part can occur for several reasons—from variations in the process or material to tooling trouble.
Read More
A Simpler Way to Calculate Shot Size vs. Barrel Capacity
Let’s take another look at this seemingly dull but oh-so-crucial topic.
Read More
How to Get Rid of Bubbles in Injection Molding
First find out if they are the result of trapped gas or a vacuum void. Then follow these steps to get rid of them.
Read MoreRead Next

Cycle Time: Science vs. Rules of Thumb, Part 1
What temperature must the polymer reach so the part can be ejected from the mold? Here, more than for any other variable, ‘rules of thumb’ unfortunately prevail.
Read More
Materials: Cycle Time: Science vs. Rules of Thumb—Part 2
Understanding cooling—how a given material develops modulus as it solidifies—requires access to data that provides some insight into the relationship between modulus and temperature. Dynamic mechanical analysis is a helpful tool.
Read More
Troubleshooting Screw and Barrel Wear in Extrusion
Extruder screws and barrels will wear over time. If you are seeing a reduction in specific rate and higher discharge temperatures, wear is the likely culprit.
Read More