
MATERIALS:The Problems with Single-Point Data
This real-world scenario explains why molders and their customers need to ‘think in terms of graphs’ and gather as much data as possible before selecting a material for an application. Part 11.
.jpg;width=70;height=70;mode=crop;format=webp)
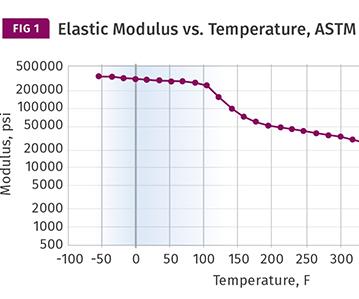
Shown here is the elastic modulus of a PBT as a function of temperature. It was made available by the material supplier and presented with the elastic modulus plotted on a logarithmic scale.
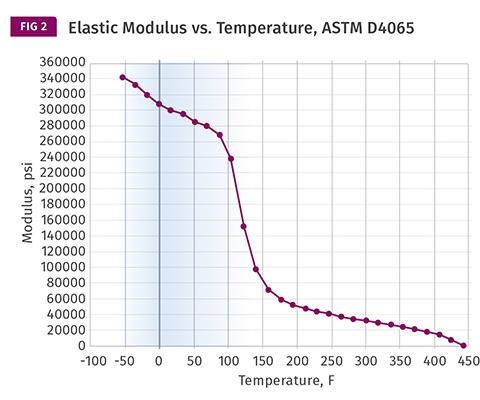
The same data in Fig. 1 is shown here re-plotted on a linear scale. It is now far more evident that by the time the material reaches the test temperature of 212 F, the modulus has declined by almost 90% compared with the room temperature value. This is the inherent response of PBT polyester to increasing temperature. The sudden decline in modulus represents the glass transition of the polymer.


The need for a more in-depth approach to presenting material properties can readily be made by illustrating how clumsy and ineffective the material selection process can be when we are limited to the understanding provided by short-term property profiles.
This particular case study involves a part that was developed and specified in an unfilled PBT polyester. Among the criteria used to make this selection was the requirement that the part be able to operate for short periods of time at a maximum temperature of 300 F (149 C). The fitness-for-use determination was based on the DTUL measured at 66 psi, which is 310 F (154 C). It is important to note that the DTUL measured at 264 psi is only 130 F (54 C). This might suggest a concern, however it was determined that the part was not under any significant stress when exposed to the upper-end temperature.


However, there was another test that the part had to satisfy, which required it to be under constant stress while exposed for a longer period of time at 212 F (100 C). The parts failed this test and the engineer directing the project had noted that the parts felt “mushy” when they came out of the test chamber. At first, this was treated as a processing problem and the molder was pressed to make improvements to the process that would allow the part to work properly.
While it is certainly true that process conditions can influence material properties, load-bearing properties at elevated temperatures are driven primarily by the degree of crystallinity in a semi-crystalline material. The degree of crystallinity is, in turn, governed by the rate at which the material cools during the molding process. This is a function of the part wall thickness and the temperature of the mold steel. Repeated attempts to optimize the mold temperature had not solved the performance problem, and analytical tests showed that the degree of crystallinity of the PBT in the molded parts had not increased appreciably during these experiments.
Finally, someone discovered the graph in Fig. 1, showing the elastic modulus of this material as a function of temperature. This graph was actually available on the website of the company that manufactures the PBT, and it was also found in a third-party database. Interestingly, the presentation format from the two sources was different. The graph from the material supplier was presented with the elastic modulus plotted on a logarithmic scale. This is commonly done by research people who are trying to capture a wide spectrum of behavior that includes the melting point of the polymer, an event that dramatically reduces the elastic modulus.
Unfortunately, most people are not accustomed to looking at logarithmic presentations of data. Even when they understand the implications they tend to subconsciously interpret the image as though it had a linear scale. When examined carefully, Fig. 1 shows a significant decline in elastic modulus that begins just above room temperature and is complete before the temperature reaches 185 F (85 C). But our eye tells us that the properties have declined by less than 50%.
Figure 2 shows the data re-plotted on a linear scale and the impact of the graph becomes more apparent. The graph shows that by the time the material reaches the test temperature of 212 F, the modulus has declined by almost 90% compared with the room-temperature value. (The room-temperature value, of course, is the only value provided on the data sheet).
Suddenly, the reason for the “mushy” feel of the part is not such a mystery. This is the inherent response of PBT polyester to increasing temperature. The sudden decline in modulus represents the glass transition of the polymer. Ironically, the much lower DTUL measured at 264 psi is a reflection of the effect of this glass transition. But as we have previously pointed out, when you are only presented with isolated points on a curve and are not shown the curve, interpretation of the big picture is practically impossible.
This may seem like a relatively minor issue, but consider the implications. With a multi-cavity tool already constructed, the material now needs to be changed. The modulus of the material at elevated temperature can be improved by incorporating glass fiber into the PBT. However, the part also must pass an impact test performed at 32 F (0 C). Addition of any filler will make the material too brittle at this temperature.
Unfilled semi-crystalline resins with property profiles similar to PBT polyester, such as nylon and acetal, will either exhibit the same problems with modulus retention at elevated temperatures or will lack low-temperature ductility. Blends of PBT polyester and polycarbonate showed some improvements that looked promising, but with the incorporation of the amorphous component, the parts were no longer to print and accurate tests could not be performed, a problem that would likely be encountered with many of the other proposed changes outlined above.
The likely candidates that will readily solve both the cold-temperature impact problem and the modulus retention at elevated temperature will be unfilled amorphous polymers. Because the application temperature can reach 300 F, the glass-transition temperature of candidate materials will likely need to be above 325 F and perhaps as high as 350 F. These materials will likely be more costly; their melt viscosity will dictate the need for a redesign of the melt-delivery system; and the cores and cavities will certainly need to be resized to accommodate the lower shrinkage, a problem foreshadowed by the PBT/polycarbonate blend. All of this adds cost and lengthens a development timeline already extended by time-wasting processing experiments.
Selecting the material for an application is supposed to occur before the mold is built. But when the guidelines for fitness-for-use are as meager as they typically are in the plastics industry, this often is not the way it works. In this case, the data needed to prevent the mistakes that were made was actually available. Unfortunately, we have not been taught to think in terms of graphs and seek out the type of information needed to make good decisions. Until we do, and until the databases become more populated with these types of resources, we will continue to rely on single-point data and it will continue to result in these costly scenarios.
ABOUT THE AUTHOR: SEPE
Mike Sepe is an independent, global materials and processing consultant whose company, Michael P. Sepe, LLC, is based in Sedona, Ariz. He has 40 years of experience in the plastics industry and assists clients with material selection, designing for manufacturability, process optimization, troubleshooting, and failure analysis. Contact: (928) 203-0408 • mike@thematerialanalyst.com.
Editor’s note: You can read the next part in the series by clicking here.


Related Content

How to Select the Right Tool Steel for Mold Cavities
With cavity steel or alloy selection there are many variables that can dictate the best option.
Read More
The Effects of Temperature
The polymers we work with follow the same principles as the body: the hotter the environment becomes, the less performance we can expect.
Read More
How to Stop Flash
Flashing of a part can occur for several reasons—from variations in the process or material to tooling trouble.
Read More
A Simpler Way to Calculate Shot Size vs. Barrel Capacity
Let’s take another look at this seemingly dull but oh-so-crucial topic.
Read MoreRead Next

MATERIALS: The Problems with Single-Point Data
Properties are generally provided at a single temperature on a data sheet. But do those properties stay the same with changing temperatures? Of course not.
Read More
MATERIALS: The Problems with Single-Point Data--Part 6
Data sheets can be limited in the information they provide on how the material performs at elevated temperatures.
Read More
MATERIALS: Impact Testing: The Problems With Single-Point Data
Knowledge of test conditions and graphical data showing the course of the impact event can help provide engineers and designers with the information they need to make informed choices about material toughness.
Read More