
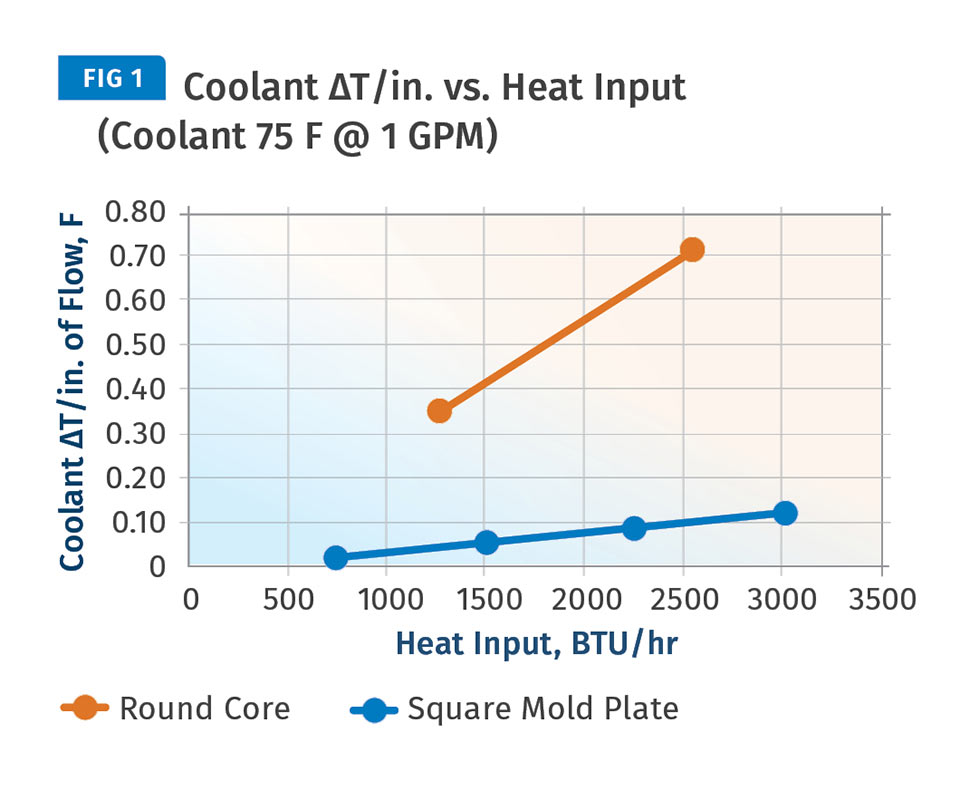
This shows an early attempt at understanding the relationship between heat input and ΔT/in. We plotted data from our round core and square mold plate with similar heat inputs but very different cooling-circuit geometry. The much shorter core cooling circuit produces a much higher ΔT/in. value.
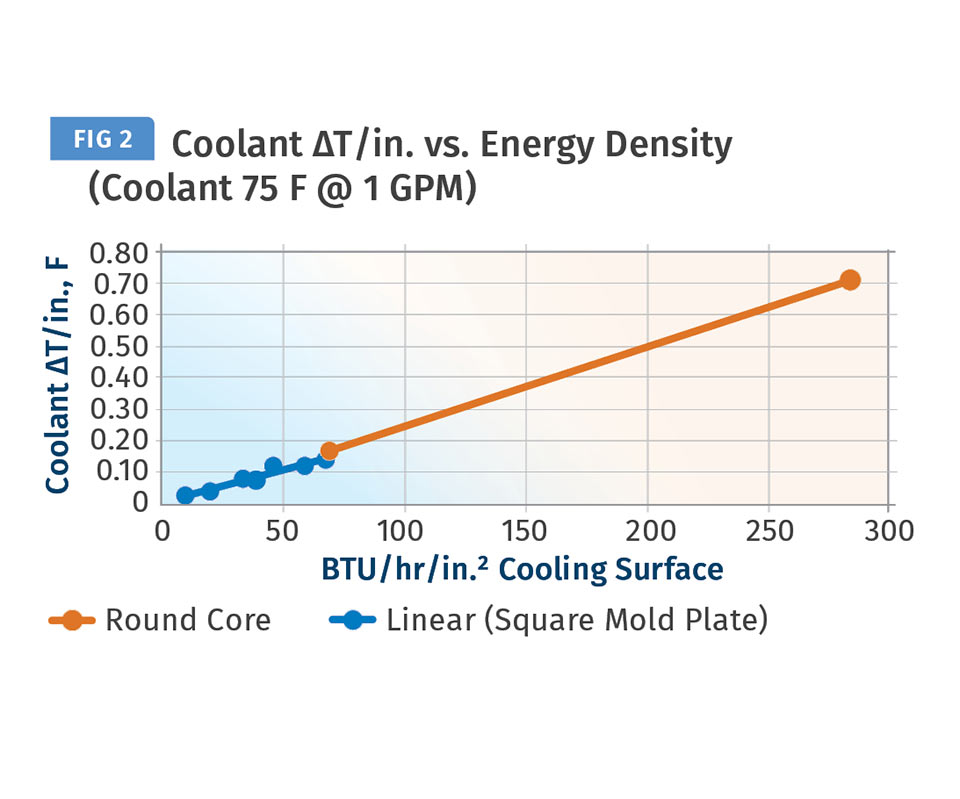
In graphing the relationship between Energy Density and coolant ΔT/in. of flow, we plotted Energy Density on the horizontal axis and coolant ΔT/in. on the vertical axis of a typical X-Y graph. This time the plots from two very different types of cooling circuits showed a remarkably linear relationship. The Energy Density with the round core was much higher than the square mold, but the two trials showed a clear linear relationship between Energy Density and ΔT/in.
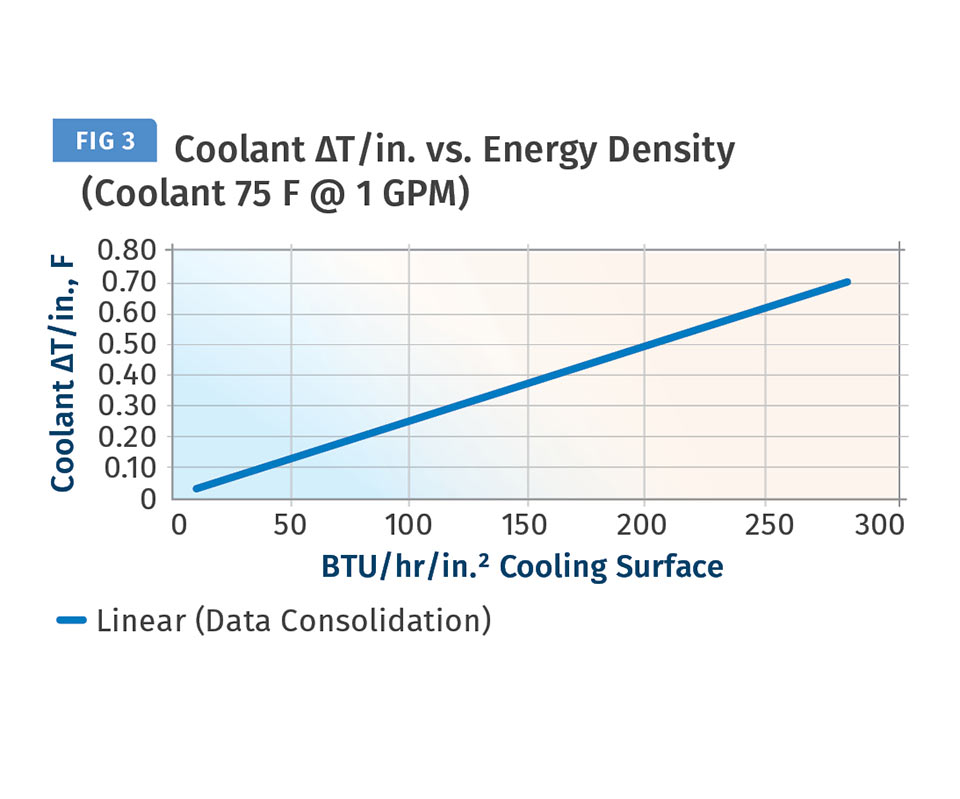
Here we used a trend line that provides a user-friendly tool for estimating ΔT/in. based on the easily calculated Energy Density value. For example, an Energy Density value of 80 BTU/hr/in.. would produce a ΔT/in. value of about 0.20°F/in.
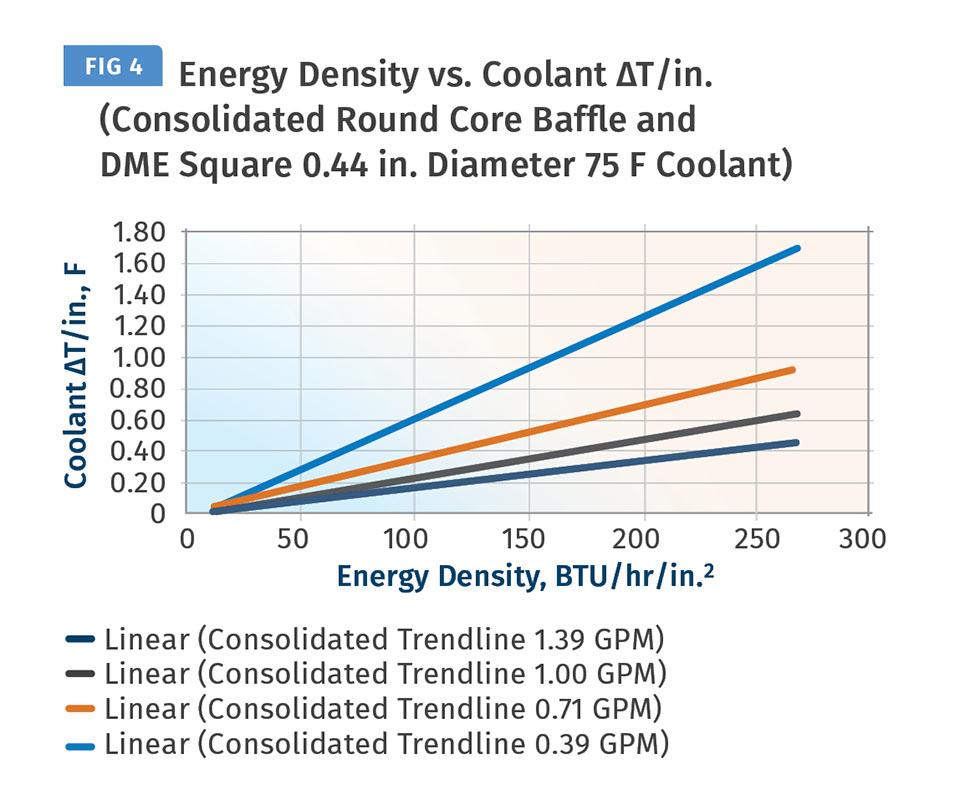
Expanded studies used new data from our core simulator and standard mold base. The studies were conducted at four different heat inputs and four different coolant flow rates. These results confirm our belief that the Energy Density vs. ΔT/in. relationship is an important step forward in the pursuit of a science-based approach to cooling-circuit design.
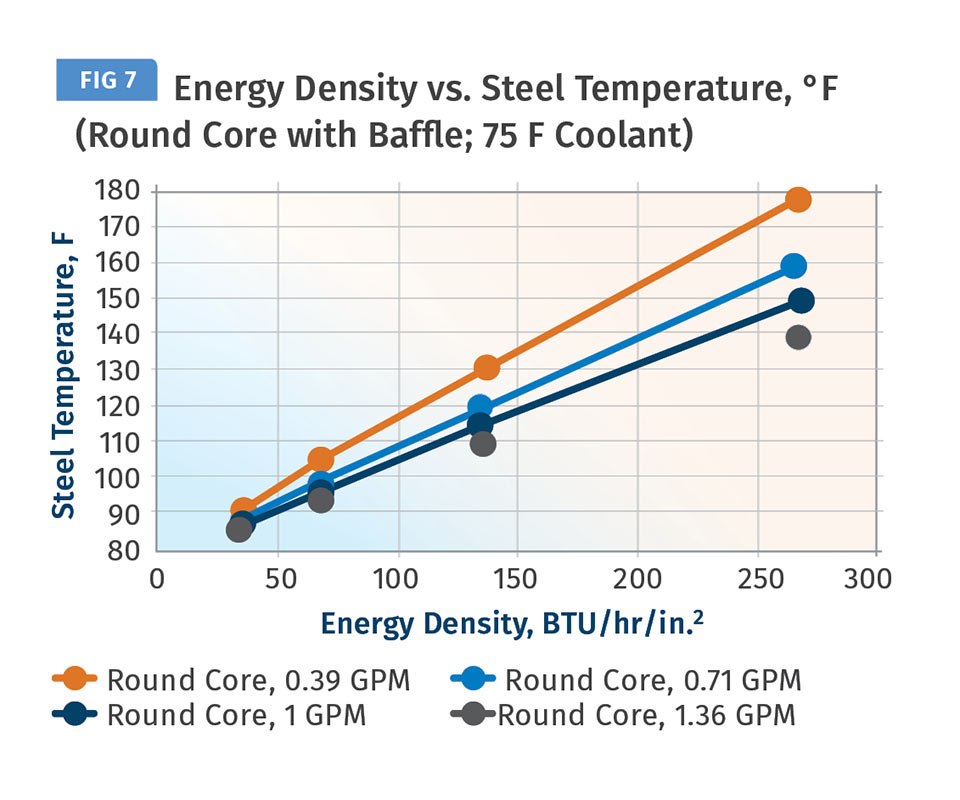
Energy Density also influences mold temperature and is useful in predicting that temperature. In our experiments mold temperatures responded linearly to Energy Density, but the mold geometry makes a difference in the temperature response.
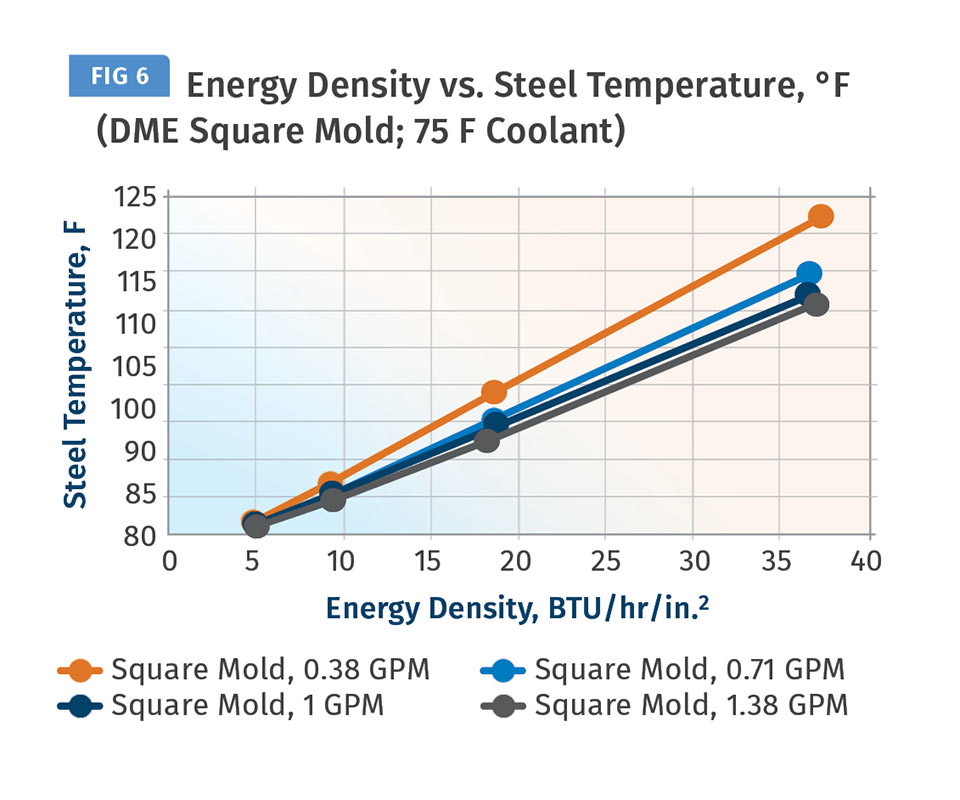
Like Fig. 5, this demonstrates the importance of designing a cooling circuit with adequate area to achieve an Energy Density value that produces the desired mold temperature.
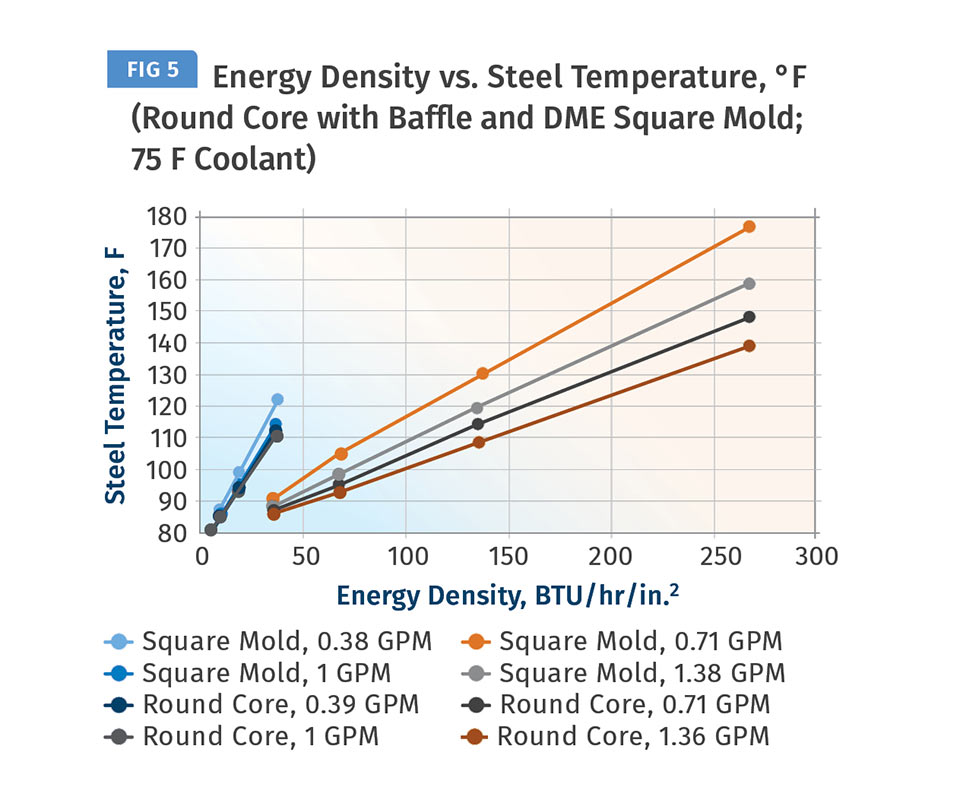
Cooling a core can be a challenge due to a smaller cooling circuit area. For example, our 1.5-in diam. round core simulator with a 7/16 diam.cooling circuit has an effective cooling area of only about 8 in.2. This results in high energy density values and greater difficulty controlling core temperature. This shows measured steel temperatures based on four values of heat input and four different coolant flow rates.
Using this thick-wall cap as a reference, we created a step-by-step procedure for how an engineer or designer would use the Energy Density method to design a cooling circuit with a specific heat-removal capacity.
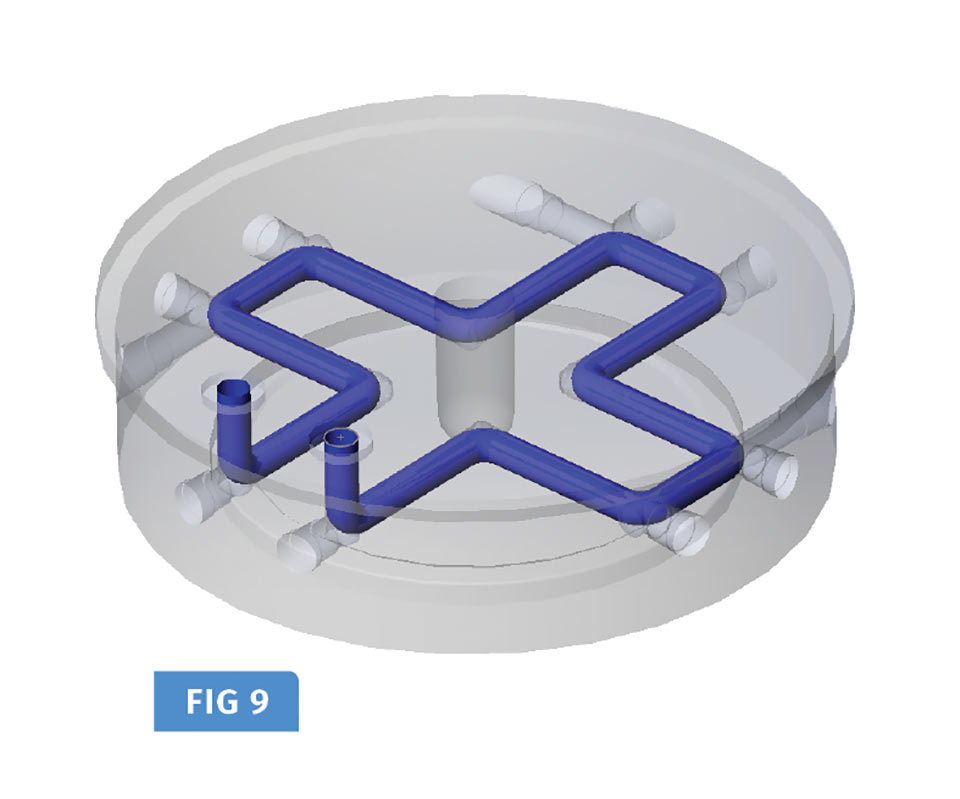
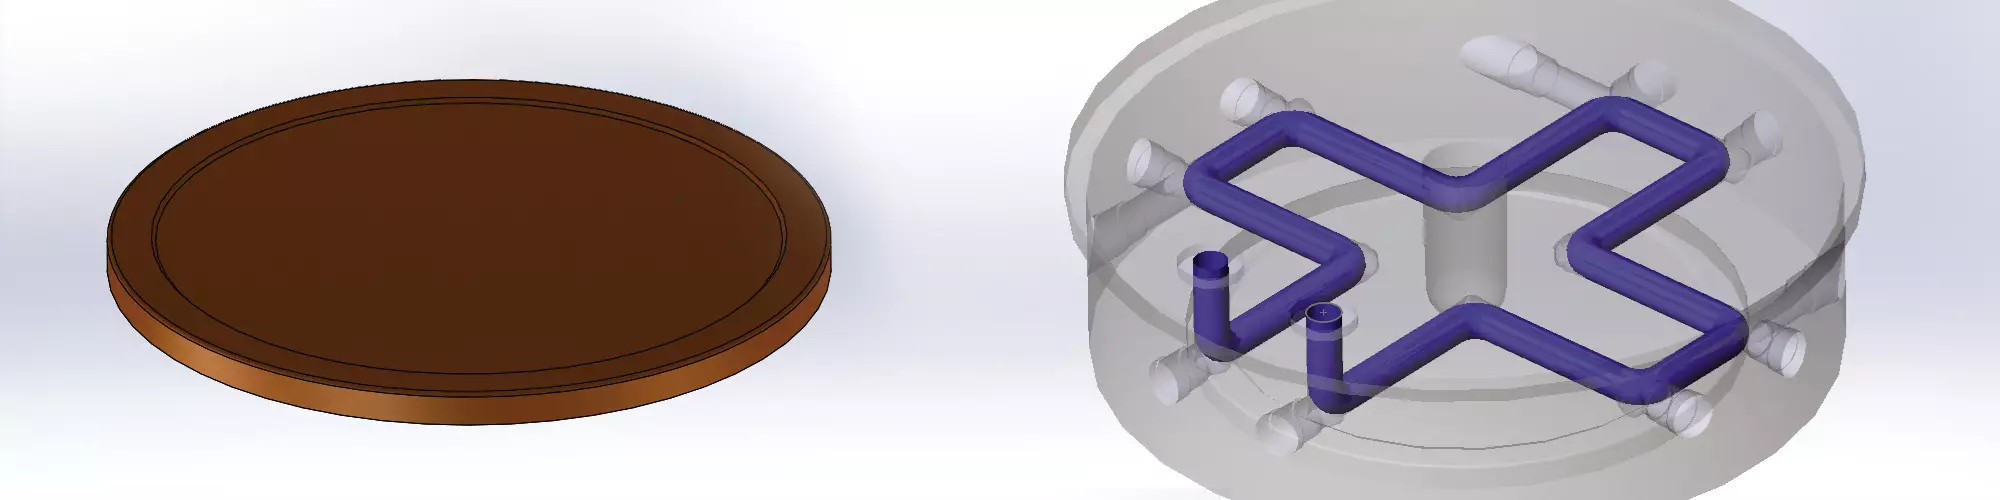
Our calculations assumed that 45% of the cooling for this part is accomplished by the cavity with a single cross-drilled cooling circuit, as shown here.

In a November 2015 feature in Plastics Technology (“Improve the Cooling Performance of Your Molds”), Burger & Brown Engineering discussed techniques for determining the cooling-capacity requirement for an injection mold.
We demonstrated how to calculate the required cooling energy for a part based on shot size, cycle time, material properties, processing temperature, and safe ejection temperature. We also demonstrated a method of calculating the required coolant flow rate based on an estimated change in coolant temperature (ΔT) as it flows through the mold.


That article ended as follows: “The foundation of designing cooling circuits is a good ΔT estimate.” We also offered the suggestion, “Processors can conduct internal studies of cooling-circuit ΔT to develop a sound basis for future designs.” We felt then that this conclusion left a lot to be desired and begged for a sound science and engineering-based approach to predicting ΔT.
Since then we have been busy thinking about and studying the ΔT issue. We have spoken before about our “mold simulators” that pump electrical energy into steel mold-shaped components. While we pump heat into our “molds” we also pump water through cooling circuits just like in a real mold. One simulator is a 12-in. square mold base with drilled cooling passages. The other is 1.5-in. diam. core that can be cooled using a baffle or a bubbler tube. We measure the coolant flow rate, coolant temperature, and steel temperature to within a tenth of a degree. All the sensors are connected to a data-acquisition system that feeds the data to a laptop. The measurements are converted into thousands of values in an Excel spreadsheet. Over the past few years we have spent hundreds of hours conducting experiments, changing variables, and studying the data. We are now prepared to tell a story about coolant ΔT.
Graphical presentation of data sometimes reveals a novel way of thinking about relationships between variables. Our studies accurately measured the heat input to the mold, simulating molten polymer being injected. This energy flow is represented by the letter Q (BTU/hr). We measured the total increase in temperature (ΔT) of the coolant as it passed through the cooling circuits. We divided the ΔT by total length of the cooling circuit to create a value of ΔT/in. We understood that there was a relationship between heat input and ΔT/in.
Figure 1 shows an early attempt at understanding the relationship. We plotted data from our round core and square mold plate with similar heat inputs but very different cooling-circuit geometry. The much shorter core cooling circuit produces a much higher ΔT/in. value.
Clearly cooling-circuit length alone does not fully describe the power or capacity of the circuit. We knew that all the heat being removed by the coolant must pass through the walls of the cooling circuit and into the coolant flowing through the circuit. Thus, the true expression of heat transferred into the coolant has to involve the area, not just the length, of the cooling circuit. It must also involve energy flow, Q (BTU/hr) along with circuit area, A (in.2). We named this value Energy Density and it is described as the energy flow divided by cooling-circuit area:
Energy Density = Q/A in BTU/hr/in.2
Our next step was to graph the relationship between Energy Density and coolant ΔT/in. We plotted Energy Density on the horizontal axis and coolant ΔT/in. on the vertical axis of a typical X-Y graph. As in Fig. 1, we included data from our round core and square mold plate as separate plots on the same graph. This time the plots from two very different types of cooling circuits showed a remarkably linear relationship. The Energy Density with the round core was much higher than the square mold, but the two trials showed a clear linear relationship between Energy Density and ΔT/in. Figure 2 shows this interesting finding. At this point we felt we were onto something meaningful and useful.
Figure 3 shows a further refinement of this data, using a trend line that provides a user-friendly tool for estimating ΔT/in. based on the easily calculated Energy Density value. For example, an Energy Density value of 80 BTU/hr/in.. would produce a ΔT/in. value of about 0.20°F/in.
Calculating the Energy Density value is as simple as determining the BTU/hr that must be removed to cool your part and dividing that value by the area of the cooling circuit. Let’s say you need to remove 1500 BTU/hr to cool the part and the cooling circuit has an area of 20.6 in.2. (7/16 in. diam. x 15 in. long). The Energy Density value would be:
1500 BTU/hr/20.6 in.2 = 72.8 BTU/hr/in.2
This Energy Density value would result in a ΔT/in. value of about 0.18°F/in. Figures 1, 2, and 3 are based on data generated with a coolant flow rate of 1 GPM and coolant temperature of 75 F. We expanded the studies using new data from our core simulator and standard mold base. The studies were conducted at four different heat inputs and four different coolant flow rates. These results are presented in Fig. 4. We believe the Energy Density vs. ΔT/in. relationship is an important step forward in the pursuit of a science-based approach to cooling-circuit design.
It would be interesting to conduct similar studies at elevated coolant temperatures, but it is our belief that the Energy Density vs. ΔT/in. relationship wouldn’t change much. Even if the mold and coolant are hotter, heat must still be removed to cool the part.
With a substantially hotter mold, more heat will be transferred to the environment by conduction to platens, natural convection, and radiation, perhaps skewing the ΔT/in. value a little lower than the graph would predict.
Energy Density also influences mold temperature and is useful in predicting that temperature. In our experiments, mold temperatures responded linearly to Energy Density, but the mold geometry makes a difference in the temperature response. Figures 5 and 6 illustrate this difference and clearly show the importance of managing Energy Density in the design process. In other words, one should design a cooling circuit with adequate area to achieve an Energy Density value that produces the desired mold temperature.
We must caution that these studies have been conducted with limited mold geometries. Based on what we have studied we believe the Energy Density vs. ΔT/in. relationship probably applies to a broader range of mold geometries. We have examined cooling data from molds running in our own molding shop and find good agreement between shop-floor data and our Energy Density research.
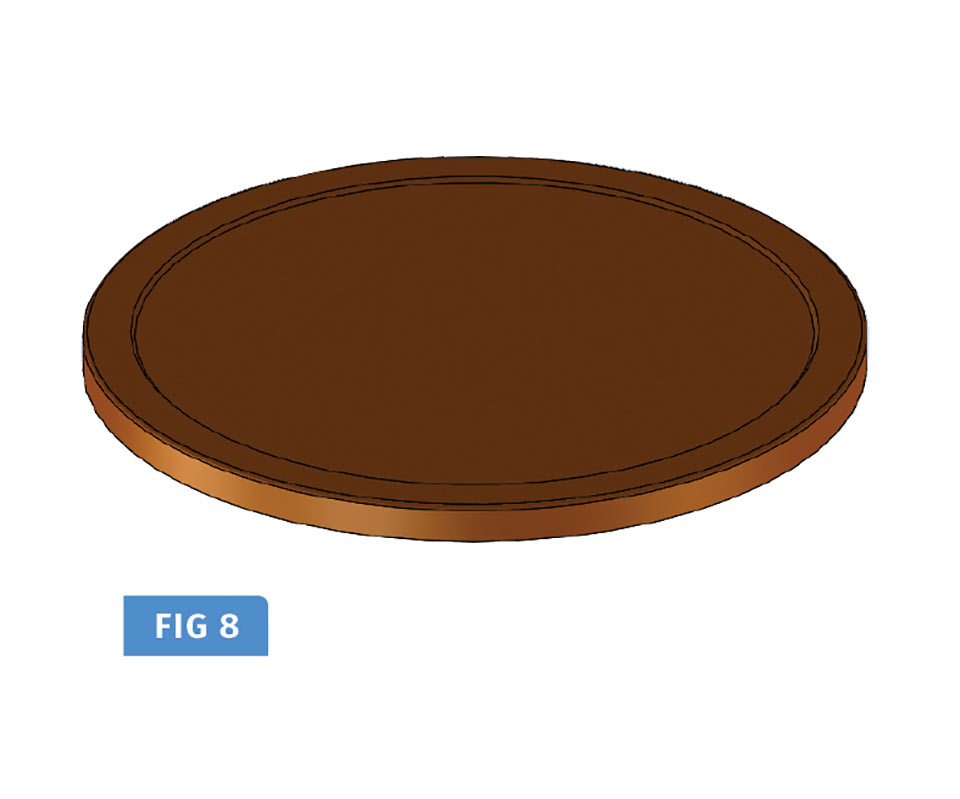
Here is a step-by-step procedure explaining how an engineer or designer would use the Energy Density method to design a cooling circuit with a desired (or required) heat-removal capacity for the thick-wall cap shown in Fig. 8.
1. Calculate the amount of heat that must be removed by the cavity side of a mold to cool a single-cavity HDPE cap. Its weight is 19.4 g (0.043 lb.) running on a 12-sec cycle.
The heat capacity: C = 0.60 BTU/lb.-°F.
The latent heat value: HL = 119 BTU/lb.
The processing (melt) temperature is 450 F and the safe ejection temperature is 150 F.
The required change in temperature,
ΔT = 450-150 = 300°F. BTU/shot =
W x ((C x ΔT) + HL) = 0.043 x ((0.60 x 300) + 119) = 12.86 BTU/shot.
BTU/hr = BTU/shot x shots/hr.
Shots/hr = 3600 sec/hr /12 sec = 300 shots/hr.
The letter Q is used to represent energy flow, BTU/hr.
Q = 12.86 BTU/shot x 300 shots/hr = 3857 BTU/hr.
We will assume that 45% of the cooling for this part is accomplished by the cavity with a single cross-drilled cooling circuit as shown in Fig. 9. Our cooling circuit must be able to remove 0.45 x 3857 BTU/hr = 1736 BTU/hr.
2. Calculate cooling-circuit surface area based on a circuit of 0.339-in. diam. x 21.1 in. long. A = π x d x L = 3.1416 x 0.339 in. x 21.1 in. = 22.47 in.2.
3. Calculate Energy Density, DE = Q/A, BTU/hr./in.2.
Energy Density = 1736 BTU/hr/22.47 in.2. = 77.26 BTU/hr/in.2.
4. Estimate ΔT/in. using the calculated energy density and the 1 GPM line on Fig. 4. The value is about 0.19 °F/in.
5. Calculate total coolant ΔT: ΔT = ΔT/in. x L = 0.19 x 21.1 = 4.01°F
6. Calculate required coolant flow rate using the expression:
• GPM = Q/(500.4 x ΔT).
• GPM = 1736 BTU/hr divided by (500.4 x 4.01°F)= 0.87 GPM.
• Check to be sure that flow will be turbulent considering the circuit diameter and coolant temperature.
7. Note that the Energy Density value calculated in Step 3 is also useful for estimating mold temperature based on Figs. 5-7.
Having studied and understood this example you might have some questions. We anticipated a couple:
• We used a 1 GPM line on the graph to calculate a required cooling flow rate of just 0.87 GPM. What gives? The heat input comes from the molten plastic or resistance heaters in the case of our lab simulation. Not all the heat goes to the coolant. Some heat transfers to the mold and the surrounding environment, depending on mold temperature. The ΔT/in. value is influenced only by the heat that makes its way into the cooling circuit.
• If you wanted to design your cooling circuit to have lower Energy Density or ΔT/in. values, what can you change? Make the cooling circuit longer or larger in diameter, or add additional circuits—in other words, create more cooling-circuit area. You can also pump more water through the circuit; but as we have discussed many times, more flow yields diminishing returns after the transition to turbulent flow. In the case of our example circuit and the choice of 1 GPM as the flow rate, we are already at a Reynolds number of nearly double the minimum for turbulent flow. More flow wouldn’t accomplish much.
ABOUT THE AUTHOR: Phil Burger, P.E., founded Burger & Brown Engineering Inc. in 1978 and served as president until 2005. Burger & Brown manufactures engineered products related to mold cooling and in-mold sensing and holds 10 patents for its products. Burger currently works part-time for the firm and has most recently developed an educational program called Scientific Cooling that was launched in October 2013. Contact: (816) 878-6675; pburger44@gmail.com; smartflow-usa.com.


Related Content

Why (and What) You Need to Dry
Other than polyolefins, almost every other polymer exhibits some level of polarity and therefore can absorb a certain amount of moisture from the atmosphere. Here’s a look at some of these materials, and what needs to be done to dry them.
Read More
How to Select the Right Tool Steel for Mold Cavities
With cavity steel or alloy selection there are many variables that can dictate the best option.
Read More
Understanding Strain-Rate Sensitivity In Polymers
Material behavior is fundamentally determined by the equivalence of time and temperature. But that principle tends to be lost on processors and designers. Here’s some guidance.
Read More
The Effects of Temperature
The polymers we work with follow the same principles as the body: the hotter the environment becomes, the less performance we can expect.
Read MoreRead Next
Improve The Cooling Performance Of Your Molds
Need to figure out your mold-cooling energy requirements for the various polymers you run? What about sizing cooling circuits so they provide adequate cooling capacity? Learn the tricks of the trade here.
Read More
Advanced Recycling: Beyond Pyrolysis
Consumer-product brand owners increasingly see advanced chemical recycling as a necessary complement to mechanical recycling if they are to meet ambitious goals for a circular economy in the next decade. Dozens of technology providers are developing new technologies to overcome the limitations of existing pyrolysis methods and to commercialize various alternative approaches to chemical recycling of plastics.
Read More
Why (and What) You Need to Dry
Other than polyolefins, almost every other polymer exhibits some level of polarity and therefore can absorb a certain amount of moisture from the atmosphere. Here’s a look at some of these materials, and what needs to be done to dry them.
Read More