
External Benchmarking of Injection Molding Energy Efficiency
In April, we discussed the use of the slope of the curve of process energy consumption versus production volume for internal benchmarking of energy efficiency.


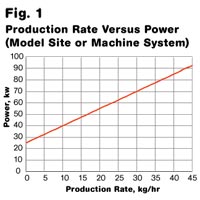
Fig. 1—Model system of variable process and fixed base loads.
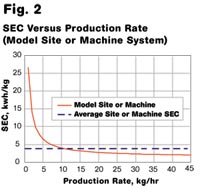
Fig. 2—Specific Energy Consumption (SEC) for the model system versus production rate. The hypothetical “average” SEC does not consider production rate.
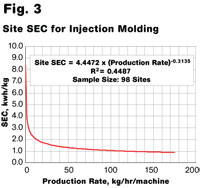
Fig. 3—Operating curve for injection molding plant SEC.
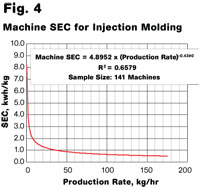
Fig. 4—Operating curve for injection molding machine SEC.
In April, we discussed the use of the slope of the curve of process energy consumption versus production volume for internal benchmarking of energy efficiency. That curve is called the Performance Characteristic Line (PCL) and the term "internal benchmarking" refers to comparing present performance to a historical standard.
Despite the usefulness of the PCL for internal assessment, it does not by itself allow for the external benchmarking that is necessary to drive significant improvements in performance. External benchmarking is when you compare your plant's performance to that of your peers or competitors. If you are an injection molder, can you afford not to know how you compare with other molders?


Benchmarking is difficult for two reasons:
- Energy use in plastics processing varies with the type of process (as explained in previous columns) and each type of process thus requires a specific external benchmarking reference.
- Energy use in any process varies with the production rate but also incorporates the fixed or base loads associated with plant services and the high fixed loads found in most plastics processing machinery.
For all materials conversion processes (not just plastics processing), it is possible to set up a model system for either a plant or a machine, where the total electrical load (in kw) consists of a fixed base load (the services) plus a process load that is directly proportional to the production rate in lb or kg per hour. The total load for this type of system is shown in Fig. 1.
The conventional measure of process energy use is the Specific Energy Consumption (SEC), which is expressed as the number of kwh used to process 1 kg or lb of material (kwh/kg or kwh/lb). The SEC for this model system can be calculated for various production rates, as is shown in Fig. 2 along with a hypothetical average of SEC results collected from different plants or machines. It is obvious that the average plant or machine SEC is not representative of the model system and that any attempt to benchmark a plastics processing method must include the production rate to produce meaningful results.
This is because the fixed loads remain effectively constant whatever the production rate and must be amortized over the actual production volume. At low production rates, the actual process load is low and the fixed load of the plant and machine dominates the total energy use. Thus the effective SEC of the process will appear high. At high production volumes, the actual process load is high and the fixed loads decrease in importance, so the effective SEC of the process can appear much lower. This is a simple amortization of the fixed loads into the variable process load, and it has two important effects:
Comparing sites or machines is meaningless unless the base loads and the production rates are taken into account.
There is no conflict of interest between being "green" and being profitable. Running plants and machines harder increases the energy efficiency of the process because base loads are amortized over higher process loads at the higher production rates.
PROCESS OPERATING CURVE
An operating curve for SEC (kwh/kg) versus production rate for injection molding has been generated from 98 injection molding plants throughout the world and the data has been fitted with a power-law "line of best fit" to produce the operating curve shown in Fig. 3.
This operating curve corrects the predicted SEC for variations in production rate, so it is now possible for an injection molding site to benchmark itself against other similar sites. This can be done by:
- Calculating your plant production rate (in kg/hr/machine).
- Finding the predicted plant SEC from Fig. 3 at your plant's production rate.
- Calculating your actual plant SEC from the total electricity use (kwh) ÷ total material processed (kg or lb).
- Comparing your actual plant SEC at that production rate with the SEC benchmark.
Individual sites can now carry out this simple process to determine their ranking relative to the average performance of the 98 sample sites around the world. Keep in mind that achieving the benchmark SEC is not a sign of good or best practice, only a sign of average practice.
MACHINE OPERATING CURVE
As with plants, it is also possible to benchmark individual machines, and the effect of the specific production rate is very similar. An operating curve for machine SEC versus production rate for injection molding has been generated from 141 hydraulic injection machines and tool combinations and the data has been fitted with a power-law line of best fit to produce the operating curve shown in Fig. 4.
This operating curve corrects the predicted SEC for variations in production rate and it is now possible for an injection molding plant to benchmark its individual machine and tool combinations against other typical machine/tool combinations. This can be done by:
- Calculating the average machine production rate in kg or lb per hr.
- Finding the predicted machine SEC from Fig. 4 at the specific production rate.
- Calculating the actual machine SEC from the total electricity use (kwh) ÷ total material processed (kg or lb).
- Comparing the actual machine SEC at that production rate with the machine SEC benchmark.
Plants can now benchmark their machine/tool energy performance relative to the performance of 141 sample machine/tool combinations—but achieving the benchmark SEC is, again, not a sign of good or best practice, only a sign of average practice.
About the Author
Dr Robin Kent is founder and managing director of Tangram Technology Ltd. in Hitchin, Herts., U.K. Tangram provides consulting engineering, training, and design services to plastics processors. Kent has been involved in injection molding and extrusion for 36 years and has worked as technical director for several major plastics processing companies in the U.K. and Europe. He can be reached at rkent@tangram.co.uk or visit www.tangram.co.uk. Articles in this series are adapted from his book, Energy Management in Plastics Processing (2008, 265 pages, www.pidbooks.com).


Related Content

Understanding the ‘Science’ of Color
And as with all sciences, there are fundamentals that must be considered to do color right. Here’s a helpful start.
Read More
How to Get Rid of Bubbles in Injection Molding
First find out if they are the result of trapped gas or a vacuum void. Then follow these steps to get rid of them.
Read More
How to Select the Right Tool Steel for Mold Cavities
With cavity steel or alloy selection there are many variables that can dictate the best option.
Read More
What to Do About Weak Weld Lines
Weld or knit lines are perhaps the most common and difficult injection molding defect to eliminate.
Read MoreRead Next

Understanding Melting in Single-Screw Extruders
You can better visualize the melting process by “flipping” the observation point so that the barrel appears to be turning clockwise around a stationary screw.
Read More
Advanced Recycling: Beyond Pyrolysis
Consumer-product brand owners increasingly see advanced chemical recycling as a necessary complement to mechanical recycling if they are to meet ambitious goals for a circular economy in the next decade. Dozens of technology providers are developing new technologies to overcome the limitations of existing pyrolysis methods and to commercialize various alternative approaches to chemical recycling of plastics.
Read More
Why (and What) You Need to Dry
Other than polyolefins, almost every other polymer exhibits some level of polarity and therefore can absorb a certain amount of moisture from the atmosphere. Here’s a look at some of these materials, and what needs to be done to dry them.
Read More