MATERIALS: Analysis Gone Wrong
A lot of resources are devoted each year to trying to figure out why products fail. Sometimes it’s because no one involved in a project realizes the data provided was wrong.
.jpg;width=70;height=70;mode=crop;format=webp)
The material being analyzed (acetal, or POM) is supposed to contain 15% PTFE. The blue line shows the weight of the sample as a function of temperature while the green line shows the rate at which weight is being lost with increasing temperature. This derivative is useful in highlighting subtle changes in the weight-loss rate that may be difficult to see in the weight loss curve
Here we see the result obtained for PC with 30% glass fiber and 15% PTFE. The test is performed properly. It begins in nitrogen until the temperature reaches 700 C. During this step the sample loses 56.03% of its original mass. Upon switching over to air, an additional 14.78% of the sample is lost and an ash of 29.18% remains. A visual examination of this ash confirms that it is the glass fiber. But the 14.78% weight loss is attributed by the analyst to the PTFE and is used as confirmation that the level is correct. But in fact the weight loss in air that is attributed to the PTFE is actually the char that formed when the PC partially decomposed in nitrogen


More than 20 years ago there was a trade publication serving the industry called Plastics Design Forum. On occasion the magazine ran a feature called “Gallery of Goofs.” It was a column that chronicled mistakes made in designing plastic parts and how these mistakes were resolved. Mistakes are great teachers, and the column conveyed the importance of adhering to good design principles. It did not run every month because it could be difficult to find contributors.
The authors had to be willing to tell a story that might cast them in an unfavorable light. In today’s world, where legal departments seem to have more to say about how a company is run than the CEO does, it would be impossible to sustain such an honest effort at teaching by example.


Another area that could benefit from such professional honesty is material analysis. It is not a field that people in the industry rely on as much as design, but a lot of resources are devoted each year to trying to figure out why products fail. A few columns ago we talked about the impediments to obtaining meaningful analytical results. This is an example of one of those projects that did produce a valid result even though no one involved knew that the provided information was incorrect.
The project involved production of parts from a custom compound based on polycarbonate with 30% short-glass fiber and 15% PTFE. Some of the parts exhibited the expected mechanical properties while others were quite brittle. When this type of difference occurs there are two things that need to be established right away: composition and molecular weight.
This article deals with the investigation into composition. The laboratory doing the comparison between the ductile and brittle parts chose a single technique to perform the evaluation, a test known as thermogravimetric analysis (TGA). This is a method that examines composition by looking at the manner in which a material loses mass as it is heated. It is an excellent tool for solving many problems related to composition.
The most common measurement TGA is called upon to make is the filler content. Almost all fillers are inorganic and therefore do not decompose even at very high temperatures. Most polymers, being organic, will burn off completely if the temperature is sufficiently high and the test is performed in the correct atmosphere. Therefore, fillers remain at the conclusion of the test as residues and their mass as a percentage of the original sample provides an excellent means of calculating the filler content. Since this was a glass-filled material, TGA was an appropriate method.
TGA can also be used to measure quantitatively the amount of various polymer ingredients in a compound, as long as the temperature at which these constituents decompose is different enough to provide good separation.
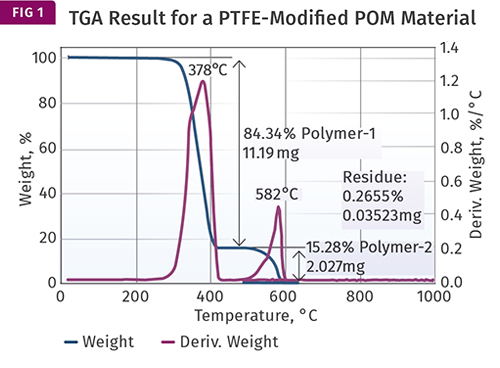
An excellent example of using TGA for this purpose is in measuring the amount of PTFE that may be present in a compound based on acetal (POM). TGA works very well in this case because the temperatures at which POM and PTFE decompose are very far apart and it is therefore possible to remove all the POM before the PTFE weight loss begins. And because TGA measures weight loss, the method is quantitative. Figure 1 shows an example of a TGA test result for a PTFE-modified POM.
The material being analyzed is supposed to contain 15% PTFE. The graph shows two plots. The blue line shows the weight of the sample as a function of temperature, while the green line shows the rate at which weight is being lost with increasing temperature. This derivative is useful in highlighting subtle changes in the weight-loss rate that may be difficult to see in the weight-loss curve, as we will see later.
The result shows a large weight loss—84.34% of the sample—occurring between 300 C and 425 C (572-797 F). This weight loss is due to the POM decomposing and is complete before the next weight loss begins near 500 C (932 F). This second weight loss, which concludes by 650 C (1202 F), is attributable to the PTFE, and accounts for 15.28% of the sample.
This part of the test is performed in nitrogen and removes only that portion of the polymer that will undergo decomposition in an atmosphere where no oxygen is present, a process known as pyrolysis. Once all the material that can be removed in an oxygen-free atmosphere is lost, the gas flowing through the sample chamber switches to air or oxygen to drive off any additional material.
In this case no additional weight loss is observed because both POM and PTFE decompose completely during the pyrolysis phase of the test. All that remains is a very small amount of ash, which in this case can be attributed to a very small amount of white colorant added to the compound.
The math is simple here. All the material is accounted for during the initial stage of the test, the separation of POM and PTFE is complete, and the composition of the material is confirmed.
But not all polymers decompose completely without oxygen, and PC is one of these. When heated in an oxygen-free atmosphere, PC loses approximately 75% of its mass. The remaining 25% forms a char that will not burn off until oxygen is introduced. In addition, PC is almost as thermally stable as PTFE and the temperature ranges at which the two polymers decompose overlap, making complete separation impossible. Therefore, while determining the glass content of the material used to make the parts in question is straightforward by TGA, measuring the PTFE content is not.
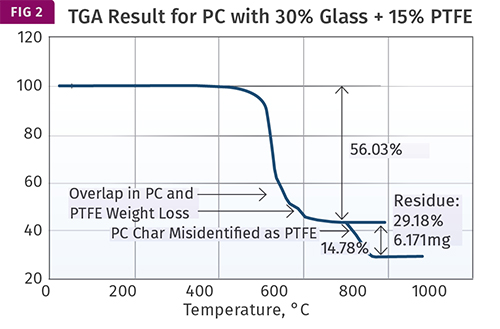
Figure 2 shows the result obtained for the PC with 30% glass fiber and 15% PTFE. The test is performed properly. It begins in nitrogen until the temperature reaches 700 C (1292 F). During this step the sample loses 56.03% of its original mass. Upon switching over to air an additional 14.78% of the sample is lost and an ash of 29.18% remains. A visual examination of this ash confirms that it is the glass fiber.
But the 14.78% weight loss is attributed by the analyst to the PTFE and is used as confirmation that the level is correct. This is where the problems start.
As we have already seen, PTFE decomposes in nitrogen at 500-650 C (932-1202 F); it cannot withstand temperatures in excess of 700 C (1292 F) in any atmosphere. The actual PTFE weight loss is confounded with the partial decomposition of the PC. The weight loss in air that is attributed to the PTFE is actually the char that formed when the PC partially decomposed in nitrogen.
Part of the reason that the analyst may have missed the overlapping weight-loss processes has to do with the subtlety of the change in slope of the weight-loss plot. This is where the derivative curve is so helpful. If this had been plotted, the weight-loss process would have shown an obvious shoulder that would make it appear that the polycarbonate lost mass during pyrolysis in nitrogen in two distinct steps.
Anyone familiar with TGA results for a pure PC would notice something wrong with this result and might have looked deeper into the problem. But without the weight-loss rate plot the change in the slope of the weight loss is not that evident and can be missed.
The second missing piece of information that the analyst required in order to accurately interpret the test result is the relationship between weight lost during pyrolysis and weight lost in air for PC.
Every polymer exhibits a distinct behavior in this respect and it is essential to be aware of this behavior in order to properly interpret TGA results.
Ironically, with this background information, the existing test results can be used to at least estimate the PTFE content of the sample and the result differs only slightly from the answer that the analyst obtained.
Next month we will go through the calculation, discuss the implications of obtaining an approximately correct answer using flawed reasoning, and review other possible routes to obtaining the needed answers.
Related Content

Datacolor Launches Annual Subscription Payment Program for Color Management Software
The subscription plan is available for Datacolor Tools color QC application for plastics and other software products.
Read More
Try This Alternate Method for Heating Your Torque Rheometer
Rheometers are generally not on all the time. And most users have found that the first test run in the instrument after heating up is not very reliable and is usually discarded. Try this method instead.
Read More
Benchtop Spectrophotometer Combines Several, Different Measurement Methods
BYK-Gardner’s new color2view said to open new horizons in color measurement.
Read More
Metaspectral to Advance Vision Technology for Recycling
Company received further funding from British Columbia’s CleanBC Plastics Action Fund
Read MoreRead Next

Understanding Melting in Single-Screw Extruders
You can better visualize the melting process by “flipping” the observation point so that the barrel appears to be turning clockwise around a stationary screw.
Read More
Lead the Conversation, Change the Conversation
Coverage of single-use plastics can be both misleading and demoralizing. Here are 10 tips for changing the perception of the plastics industry at your company and in your community.
Read More
Advanced Recycling: Beyond Pyrolysis
Consumer-product brand owners increasingly see advanced chemical recycling as a necessary complement to mechanical recycling if they are to meet ambitious goals for a circular economy in the next decade. Dozens of technology providers are developing new technologies to overcome the limitations of existing pyrolysis methods and to commercialize various alternative approaches to chemical recycling of plastics.
Read More