
MATERIALS: Impact Testing: The Problems With Single-Point Data
Knowledge of test conditions and graphical data showing the course of the impact event can help provide engineers and designers with the information they need to make informed choices about material toughness.
.jpg;width=70;height=70;mode=crop;format=webp)
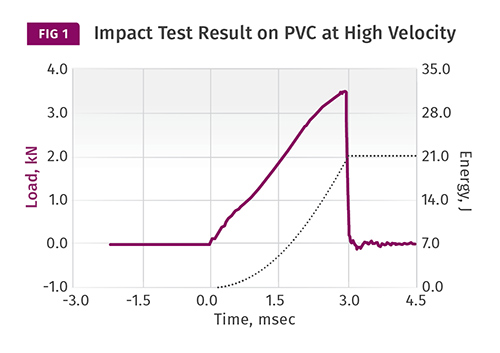
This instrumented impact test on PVC shows results characteristic of brittle failure.
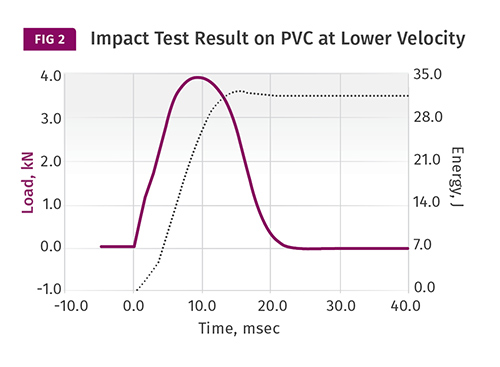
This impact test performed on a specimen of the same PVC material shows very different results from those in Fig. 1. First, the total energy collected is approximately 50% greater. The test duration is also longer. But the most significant difference is the change in the failure mode from brittle to ductile.


As we have discussed in preceding columns, the tests most commonly used to characterize impact performance in plastics involve a very narrow range of the parameters that influence the test result—temperature and strain rate. As with most tests performed for publication on the data sheet, impact evaluations are typically limited to tests conducted at room temperature (73 F/23 C). Occasionally, one or perhaps two sub-ambient conditions are used.
Frequently, there is a dramatic decline in impact strength at the lower temperatures. This indicates that the material being evaluated has a ductile-to-brittle transition temperature somewhere between the test temperatures, but we cannot be sure exactly where this occurs. We do know, however, that this transition takes place over a relatively narrow temperature range. The other shortcoming of these tests is the general inability to control velocity. Finally, while it is possible to instrument the pendulum test apparatus in order to create a graphical output of the impact event, this enhancement is seldom employed and the results are not published even on those rare occasions when it is done.


The ability to control velocity and provide graphical results comes from more sophisticated pieces of equipment known as instrumented falling-dart impact testers. These employ a tower, and the crosshead is raised to a specific height so that when it is dropped it achieves the desired velocity as it strikes the sample. The sample is either a disk or a plaque that sits flat on a platform and is impacted by a cylindrical object called a tup. The tup can vary in diameter and has a radiused end that contacts the sample.
This apparatus is modeled after the Gardner impact test; however these devices employ an energy much higher than what is required to make the test specimen fail. This ensures that the velocity of the tup does not change appreciably during the test. This is important, since impact resistance is a function of strain rate, as we have already established. Inside the tup is a transducer that monitors the force generated by the tup on the sample and feeds several thousand data points characterizing the event to a computer. Software reports a number of parameters associated with the test, including the velocity at impact, duration of the test, sample deflection, and energy required to produce failure of the sample.
But the real value of this method is the fact that it produces a graphical output of load and energy plotted as a function of time. The results of this type of impact test can be found on some data sheets, and they are often provided at room temperature and a sub-ambient condition such as -20 C or -40 C. These tests are typically only performed on very ductile materials that produce excellent values such as polycarbonate and related alloys such as PC/ABS and PC/polyester. But the result is given only in terms of total energy, and no insight is provided into how the event unfolded.
Figure 1 shows the graph associated with an instrumented impact test. This test was performed on a PVC material and the total energy collected at the conclusion of the test is shown as 21 joules, or approximately 15.4 ft-lb. This is the only information that would be provided if the test result were to be reported on a data sheet. But the curves tell us so much more.
In this case, the load builds up rapidly once the moment of impact has occurred. Once the maximum value is achieved, the load declines rapidly and the test is completed in approximately 3 milliseconds. Even visually we can determine that the majority of the total energy was collected before maximum load was reached and this behavior characterized what would be considered a brittle failure. Some materials exhibit an even more brittle response than this material, and in that case the load curve may exhibit multiple peaks and some noise as the various layers of the sample fail in a rapid sequence that produces total energies as low as 2-3 ft-lb. Sample thickness will obviously influence the result, and the total energy can be divided by this thickness to normalize the results to ft-lb/in., although this is rarely done.
Figure 2 shows an impact test performed on a specimen of the same PVC material that looks very different from the results shown in Fig. 1. First, the total energy collected is approximately 50% greater at 32.5 joules or 23.9 ft-lb. The test duration is also longer, a little over 20 millisec as opposed to 3 millisec. But the most significant difference is the change in the failure mode.
The load curve, rather than dropping abruptly after the achievement of maximum load, tails off gradually and the peak of the load curve is rounded rather than sharp. The energy collected up to the point of maximum load comprises only about half of the total energy required to produce complete failure. These features are characteristics of a ductile response, and the significant amount of energy expended to complete the failure after the point of maximum load is referred to as energy management. True toughness is captured after maximum load; the energy required to reach maximum load is more attributable to rigidity, not ductility.
So what aspect of the test conditions distinguishes the results shown in Figs. 1 and 2? While a change in temperature could certainly account for this, the temperature of both tests was the same. However, the velocity associated with the test result in Fig. 1 was 15 ft/sec (4.57 m/sec) while the test result shown in Fig. 2 was obtained at a velocity of 5 ft/sec (1.52 m/sec). The faster speed produced a result that would be more typical of a test performed at a lower temperature.
Ironically, it was the data sheet that led us to perform this experiment in the first place. The notched Izod impact strength for this material at 73 F (23 C) is 8 ft-lb/in., a value associated with a ductile material. However, this supplier had also provided a data point for 0 F (-18 C). At this lower temperature the result was only 1 ft-lb/in., a value characteristic of a brittle material. The fact that this material exhibited a ductile-to-brittle transition temperature somewhere between these two temperatures led us to expect that it might also display a ductile-to-brittle transition strain rate if we did not change the temperature. The test result confirmed this and also helped to solve a performance problem that had been blamed on the material but actually was due to a change in the way the molded parts were being assembled.
So as with the properties of strength and modulus we have again demonstrated the importance of test conditions and the ability to provide graphical data in order to give engineers and designers the information they need to make informed choices about material performance. Next month, we will extend this discussion to include thermal properties.


Related Content

PBT and PET Polyester: The Difference Crystallinity Makes
To properly understand the differences in performance between PET and PBT we need to compare apples to apples—the semi-crystalline forms of each polymer.
Read More
Are Your Sprue or Parts Sticking? Here Are Some Solutions
When a sprue or part sticks, the result of trying to unstick it is often more scratches or undercuts, making the problem worse and the fix more costly. Here’s how to set up a proper procedure for this sticky wicket.
Read More
How to Stop Flash
Flashing of a part can occur for several reasons—from variations in the process or material to tooling trouble.
Read More
The Effects of Temperature
The polymers we work with follow the same principles as the body: the hotter the environment becomes, the less performance we can expect.
Read MoreRead Next

MATERIALS: The Problems With Single-Point Data
Polymer properties are not constant as a function of temperature, and even small temperature changes can affect properties.
Read More
MATERIALS: The Problems with Single-Point Data
In plastics, notched Izod and Charpy test results have been complicated by the way they are reported.
Read More
MATERIALS: The Problems with Single-Point Data
Engineers who are used to working with metals are surprised that plastics cannot operate as close to their yield points as can metals. The yield point is not enough to tell you how the material reacts to stress.
Read More