
Mold Simulation: Get Best Results With Good Materials Data
Want the best results from your flow analysis software? Of course you do. But you stand a better chance for success if you pay particular attention to the material data used by the software.
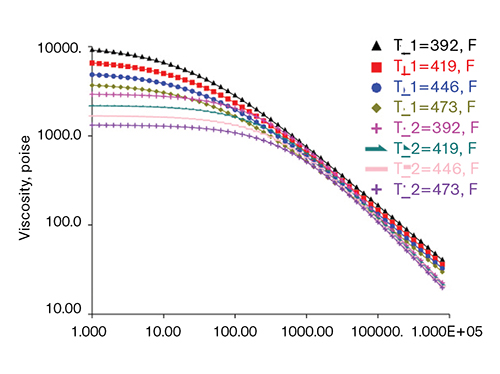
FIG. 1 MFI can be a poor predictor of how material will flow. This graph shows curves for two different 20 MFI materials at the same range of temperatures. The viscosity levels for the shear rates in the MFI range vs. those in injection molding are orders of magnitude different.
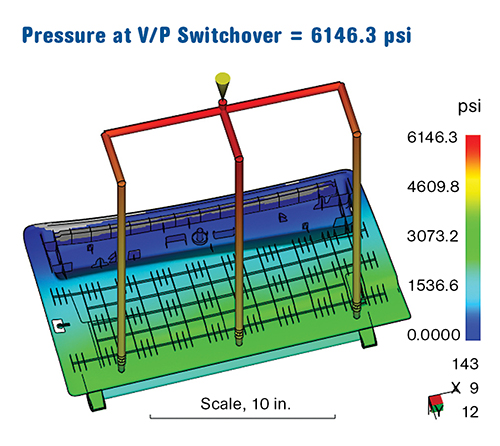
FIG. 2a, 2b Juncture loss is a material-specific pressure loss that occurs at junctures within the melt-delivery system where there is a large change in orifice size, such as where the sprue meets the runner or where the runner meets the gate. Comparing top and bottom images, there is a 13% difference in pressure predictions with and without juncture loss data and a corresponding 5% difference in shrinkage.
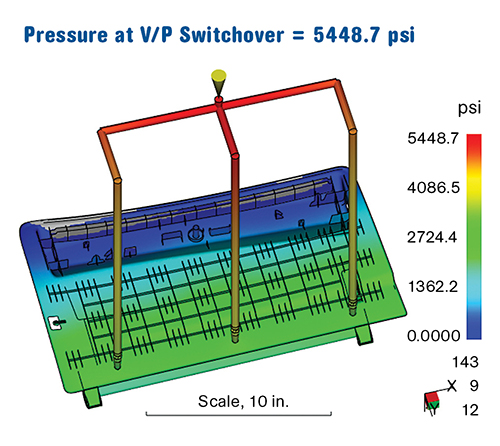
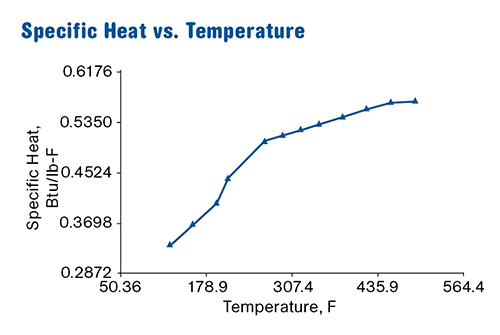
FIG. 3a, 3b Thermal properties include the specific heat (top) and thermal conductivity values (below). It is important that these values be measured over a wide range of temperatures because it is common for a materials database to have just a single data point for each of these properties, which can significantly compromise the results.
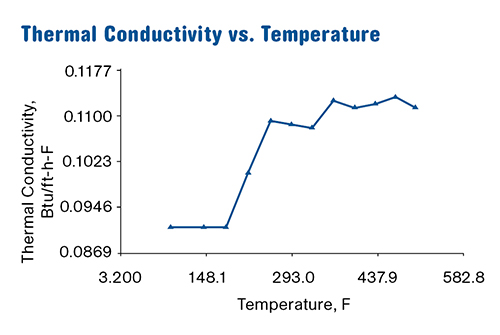
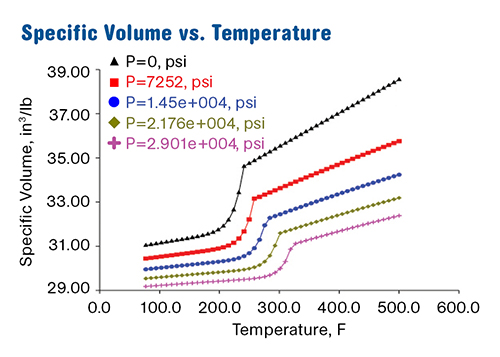
FIG. 4 Compressibility data is used during filling analysis, but it has the greatest impact during packing analysis. These curves describe how the material’s specific volume (inverse of density) changes in reaction to changes in temperature (cooling) and packing pressure.
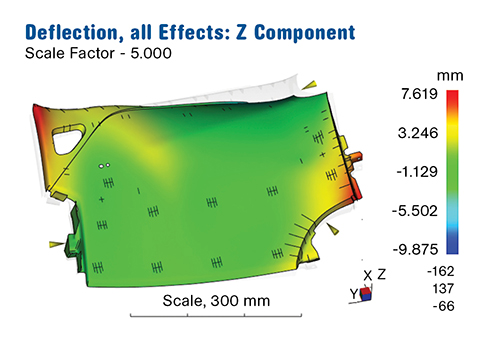
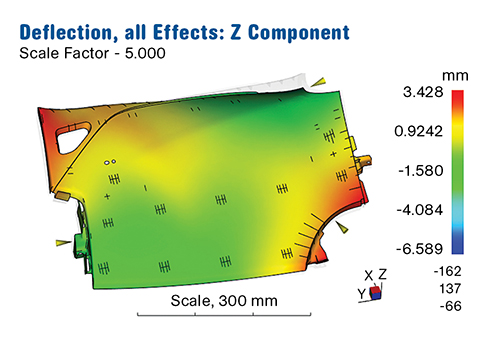
FIG. 5a, 5b CRIMS (Corrected Residual In-Mold Stress) is the empirical testing of a series of molded tag die parts made from a particular resin. The effects of not having CRIMS data are illustrated in the above warpage results. The simulation on the top was performed with CRIMS data, and the one below was performed without CRIMS data.


Most people who have been involved in plastics over the last 20 years have had some experience with flow analysis. For the uninitiated, flow analysis is computer simulation that provides a way to predict how plastic will flow in an injection mold and how that process will affect anything from the fill pressures to the shrinkage, cooling, and finally warpage. Anyone who has had any experience with simulation is usually quick to give you an opinion about it.
Those opinions usually fall into one of three categories: 1) It stinks and never predicts anything right. 2) It is close enough and provides a decent trend. 3) It has been spot on. Where you fall in that spectrum of responses depends to a large degree on how good the material properties were for those simulations.


'GIGO' RULE APPLIES
Any good simulation model depends on good inputs on several fronts. A skilled, experienced analyst will be able to evaluate those inputs to get the most out of the analysis. For injection molding simulation, the part and mold geometry and the processing conditions must all be modeled properly. Additionally, particular attention must be paid to the material properties, which is the focus of this article. It discusses material data required for Autodesk Simulation Moldflow Insight (ASMI), the most commonly used simulation software.
Depending on what type of simulation is being done, there could be up to 10 sets of material properties needed to fully characterize a plastic material for analysis purposes. Any uncertainty in the quality of the data generated during material characterization will lead to uncertain results. The pictures generated from those results will look very nice, but they will likely be wrong. It’s the classic “garbage in, garbage out” (GIGO) scenario. Would any of you like to build or run a mold based on a guess at the results? If you are responsible for reviewing Moldflow results, it is critical that you know how good the material data is. Otherwise, you could be in for a big surprise when you start molding parts. So, rather than being a trash-loving Oscar the Grouch, let’s see what good material properties look like for a robust simulation.
FILLING/PACKING ANALYSIS
The most often used simulations are for the filling and packing stages. The main objective of filling analysis is to predict the filling pattern based on the gating scheme and process conditions that were input to the model. The filling pattern allows us to see if there is reasonable flow balance, determine whether the pressure and clamp-force requirements are reasonable, and whether or not the weld-line locations are problematic. With packing analysis, we are able to predict how packing pressure is distributed to different areas of the part and how those areas shrink relative to one another. The following material properties are used by simulation software to determine a material’s flow and pack behavior.
•Melt rheology
•Juncture loss
•Compressibility (pvT)
•Thermal properties (specific heat, thermal conductivity, and transition temperature).
Melt rheology is the prime mover of flow behavior. It describes the relationship between a polymer’s viscosity and its shear rate and temperature. Figure 1 shows viscosity data generated on a capillary rheometer for a realistic range of shear rates. These curves can be generated for any straight, filled, or glass-reinforced resin. On the Y-axis is the relative viscosity, and on the X-axis is the shear rate. Each curve represents a different temperature within the typical range of melt temperatures for that polymer grade.
In injection molding, all plastic flow is laminar, which means that it flows in layers. Those layers flow at different speeds relative to each other when you look at a section across the wall thickness. Because they flow at different speeds, they generate shear forces, which are frictional in nature. Those frictional forces align the polymer molecules and make them easier flowing. Those frictional forces often outweigh the cooling of the material from the mold steel and cause shear heating of the material. Both of these effects are shown in the graph, where increases in temperature and shear rate result in a decrease in viscosity.
One thing that should be noted is that seemingly similar materials can often have dramatically different viscosity curves. It is common in injection molding to evaluate the processability of two materials by comparing the melt flow index (MFI) of each. As pointed out by Mike Sepe in several recent Materials Know How columns in Plastics Technology, this can be a poor way to judge how well a material will flow. The reason is that the MFI measurements are taken at the far left side of the rheology curves (very low shear rates)—nowhere near the shear rates that are generated in injection molding.
Figure 1 shows two different 20 MFI materials superimposed. The units for MFI are grams/10 min. Do you know anyone molding a 20-g part for which it takes 10 min to fill the mold? Bulk shear rates will typically be in the 50 to 1000 sec-1 range in the part, and 5000 to 100,000 sec-1 in the gates. If you look at the viscosity curves, the viscosity levels for the shear rates in the MFI range vs. those in injection molding are orders of magnitude different.
One of the more overlooked material properties that can be used in filling analysis is juncture loss. Juncture loss is a material-specific pressure loss that occurs at junctures within the melt-delivery system where there is a large change in orifice size, such as where the sprue meets the runner, or where the runner meets the gate. Juncture loss coefficients (also known as Bagley correction coefficients) are derived from a series of capillary viscosity experiments with different die lengths.
Measured pressure losses from the experiments are compared with simulated pressure losses for the same geometries to find the best fit for the coefficients. Since packing results depend a great deal on the pressure predictions, it can be very important to have juncture loss data for the simulation. In Figs. 2a and 2b, there is a 13% difference in pressure predictions with and without juncture loss data and a corresponding 5% difference in shrinkage levels.
Thermal properties data is used not only by filling and packing analysis, but also by cooling analysis (see Figs. 3a, 3b). These include the specific heat and thermal conductivity values. It is important that these values be measured over a wide range of temperatures because it is common for a materials database to have just a single data point for each of these properties, which can significantly compromise the results. The same thermal properties must be measured for the mold steel, particularly if higher conductivity metals, such as beryllium-copper alloys, are used for inserts. These properties are critical to determining the rate at which the plastic gives up its heat to the mold steel, which in turn can affect several other results—pressure, material freeze, shrinkage, and warpage.
The last set of data used during filling and packing analysis is the compressibility data, a.k.a. pvT (pressure, volume, temperature) data (Fig. 4). Although it is used during filling analysis, it has the greatest impact during packing analysis. These curves describe how the material’s specific volume (ratio of volume to mass, or inverse of density) changes in reaction to changes in temperature (cooling) and to various packing-pressure levels.
If you follow any one of the curves from right to left, you see that the temperature is dropping. As the temperature decreases, the specific volume decreases too, which means that the material shrinks and densifies as it cools—something we already know. Each of those curves represents a different pressure level. The lowest pressure is the top curve, and the highest pressure is the bottom curve. So, at a given temperature, higher pressure results in lower specific volume, which indicates that the material is being compressed by the pack pressure.
This is an area where database properties may not have been fully characterized and are substituted from another material. If that is the case, the shrinkage (and therefore, warpage) predictions can be erroneous.
WHAT'S ‘CRIMS’?
The results generated from filling, packing, and cooling analysis all have a role in predicting the warped shape of the part after it comes out of the mold. One of the calculations done in the background is a residual stress calculation. Those residual stresses generated during filling, packing, and cooling become the internal loads applied to the part that manifest themselves as warpage. Moldflow some years ago developed an empirical material test to correct the residual stress calculations with empirical data in order to provide a better prediction of the material’s shrinkage.
In comes CRIMS, or Corrected Residual In-Mold Stress. The empirical testing consists essentially of a series of molded tag die parts made from the resin in question. The mold is designed so that there is unidirectional flow. A series of 28 moldings are made under various conditions, including changes in wall thickness, fill speed, pack pressure, melt and mold temperatures, and cooling time. The samples are allowed to shrink for one week, and the shrinkage in the flow and cross-flow directions are measured at various etched locations along the part. The data is evaluated and CRIMS coefficients are generated.
Since plastics in general, and fiber-filled plastics in particular, do not shrink isotropically (the same in all directions), these shrinkage variations play a significant role in determining the warped shape of a part. Running warpage simulation without this data can be dangerously inaccurate, especially for fiber-filled material. The effects of not having CRIMS data are shown in Figs. 5a and 5b, opposite. The simulation on the left was performed with CRIMS data, and the one on the right was performed without it.
Why the fuss? Getting accurate results is the goal of having analysis done at all. But by the time a decision has been made to do simulation work, it may be too late to have a material tested. If the moldmaker has already been kicked off, then the clock is ticking. But even at that late stage, it’s still better to have the testing done because it can really come back to bite you after the fact. However, you can be proactive and kick analysis off earlier, which gives you more time to have material testing done, if necessary.
If you have a set of materials that are commonly used for your parts, you should consider having those materials tested so that they can be used for a number of molds. Autodesk Moldflow Plastics Lab can provide the full range of testing that is needed for simulation, and there are other contract laboratories that can do some of the testing as well.
Sometimes the material supplier can do some testing. If it’s not possible to have the material tested, you should rely on the expertise of the analyst or the material supplier to choose a viable substitute, but recognize that there could be errors in the results.
Having simulation done for your molds will give you insight into many things. From part design to mold design and processing, an experienced analyst will help you compare a lot of different scenarios and ultimately decide what works best for your part. Having robust material characterization will provide the most accurate results. Now that you know what makes for a good characterization, you will be able to ask the right questions the next time you look at an analysis.
ABOUT THE AUTHOR
Tim Lankisch has been with CAE Services, Batavia, Ill., for the last 20 years. He is currently the director of engineering. He is expert-certified in Autodesk Simulation Moldflow Insight, as are five of his team members. CAE Services has been a major supplier of injection molding simulation services in North America since its founding in 1988. Contact: (630) 761-9898; email: tim@caeservices.com; website: caeservices.com.


Related Content

How to Achieve Simulation Success, Part 1: Model Accuracy and Mesh Decisions
Molding simulation software is a powerful tool, but what you get out of it depends very much on your initial inputs. Follow these tips to create the most successful simulation possible.
Read More
Take Time to Save Time: Five Steps in Mold Design to Reduce Back-End Troubleshooting
Westminster Tool shares how the one week it typically takes to perform these five steps in the design phase can save three weeks or more in an overall tool build.
Read More
50 Years...600 Issues...and Still Counting
Matt Naitove marks his first half-century in plastics reporting, with a few of his favorite headlines.
Read More
Injection Molding Simulation Meets the Real World
Direct data interface between molding simulation and the injection machine links the computer model to the real-world process. This can improve results from product and mold design through ongoing production. A case study demonstrates these benefits for automotive components in a family mold.
Read MoreRead Next

How Polymer Melts in Single-Screw Extruders
Understanding how polymer melts in a single-screw extruder could help you optimize your screw design to eliminate defect-causing solid polymer fragments.
Read More
People 4.0 – How to Get Buy-In from Your Staff for Industry 4.0 Systems
Implementing a production monitoring system as the foundation of a ‘smart factory’ is about integrating people with new technology as much as it is about integrating machines and computers. Here are tips from a company that has gone through the process.
Read More
Troubleshooting Screw and Barrel Wear in Extrusion
Extruder screws and barrels will wear over time. If you are seeing a reduction in specific rate and higher discharge temperatures, wear is the likely culprit.
Read More