The Strain Rate Effect
The rate of loading for a plastic material is a key component of how we perceive its performance.
In a previous article, we briefly discussed the influence of time as the second important factor in the mechanical response of polymers. The flip side of time is strain rate.
The rate of loading for a plastic material is a key component of how we perceive its performance. High strain rates—events that occur over a short period of time—tend to favor the elastic properties of materials. Elasticity is associated with load-bearing performance as embodied in properties such as strength and stiffness. However, low strain rates—events that occur over a longer time frame—favor the viscous or energy-damping aspects of material behavior. Viscous flow is associated with energy management, often referred to as impact resistance or toughness.
Here we can see another manifestation of the relationship between time and temperature. We know that as temperature declines, materials become stronger and stiffer but less impact resistant, while increasing temperatures produce the opposite response. This suggests that we will observe the same effect on material properties by varying strain rate as we do when we change temperatures. This, in fact, turns out to be the case.
Impact Testing
Consider these two applications. The first involves impact tests performed on a PVC compound. This is not your typical notched Izod impact test. This is a falling-dart impact test with an instrumented striking device called a tup. The placement of a transducer inside the tup allows us to collect thousands of data points during the impact event and display them immediately after the conclusion of the test.
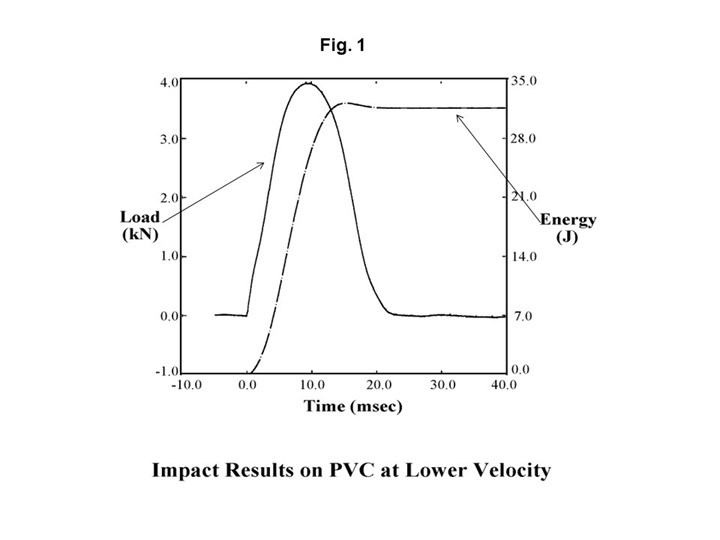
FIG 1 A falling-dart impact test with an instrumented tup. Shown are the results for PVC at a low impact velocity of 5 ft/sec. The solid line represents the load on the test specimen, while the dotted line represents the energy collected during the course of the test. Both are plotted as a function of time.
Figure 1 shows the graphical result of such an impact test performed on the PVC at an impact velocity of 5 ft/sec. The solid line represents the load on the test specimen while the dotted line represents the energy collected during the course of the test. Both of these are plotted as a function of time. The load curve rises to a maximum value as the tup makes contact with the test specimen and then places increasing pressure on the specimen, causing an increase in the load.
At some point the load reaches a maximum and begins to decline as the tup begins to penetrate the sample. As this penetration occurs, we continue to collect a significant amount of additional energy, and at the conclusion of the test we can see that the area under the load curve is almost evenly divided between the time frame before and after maximum load. While the whole event is over in 20 millisec, this result is typical of a ductile response and indicates that the material is quite tough. If we reported this result on a data sheet, all we would see is the final result of 32 Joules, or about 23 ft-lb, but we would not know how the material failed because the failure mode is never reported on a standard data sheet.
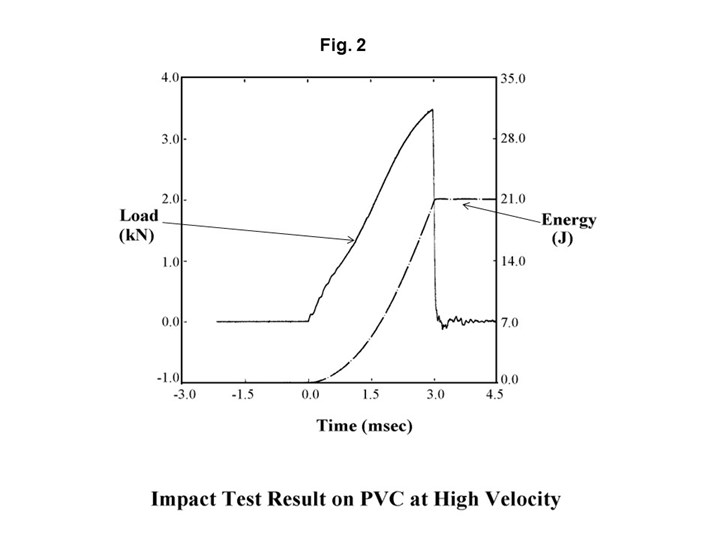
FIG 2 This shows the response of the same material at a higher impact velocity of 15 ft/sec. The solid line represents the load on the test specimen, while the dotted line represents the energy collected during the course of the test. Both Fig. 1 and Fig. 2 are plotted as a function of time.
Figure 2 shows the response of the same material when the velocity of the impact event is increased to 15 ft/sec. The result is significantly different. First, the impact event only lasts 3 millisec, seven times shorter, even though we only increased the velocity by a factor of three. In addition, the total energy required to fail the specimen declines to 21 J, or about 15 ft-lb. But the cause of both of these changes is related to the difference in the failure mode. In this case the material fails abruptly as soon as maximum load is achieved. Almost no additional energy is collected. This is characteristic of a brittle failure mode.
So while holding temperature constant, we have produced a change from ductile failure to brittle failure by simply changing the velocity of the impact event. If we inspected specimens from the two tests we would see that the ductile failure would produce only a small hole punched through the specimen. This piece of displaced material would still be attached to the specimen; stress whitening would be evident around the impact zone; and no cracks would be visible. The brittle failure would show jagged edges around the impact zone where material has been removed from the specimen and secondary cracks would radiate from the primary failure zone. While energy to failure is certainly important, the failure mode is also critical in many applications, since sharp edges on a broken part can constitute an additional hazard. This also explains why the automotive industry requires that instrumented impact tests be performed at two velocities when a new material is being qualified.
Interestingly, if we examine the data sheet for this PVC, we can see this transition from ductile to brittle behavior in notched Izod impact test results performed at two different temperatures. The data sheet for this grade of PVC reports a value of 8 ft-lb/in. at 73 F but only 1 ft-lb/in. at 0°F. So just as there is a ductile-to-brittle transition temperature for plastic materials there is also a ductile-to-brittle transition strain rate.
Tensile Testing
We can observe this behavior using a lower strain-rate test such as a tensile test. Tensile tests apply stress over a significantly longer time scale than impact tests. Instead of a few millisec, tensile tests can last for 30 to 300 sec. But within this longer time envelope we can vary the strain rate by pulling the sample at different rates. The ASTM method allows for crosshead speeds of 0.2, 2.0, or 20 in./min (5, 50, or 500 mm/min). If we perform tensile tests at all three of these speeds on a given material we can see the effect on the measurements we obtain.
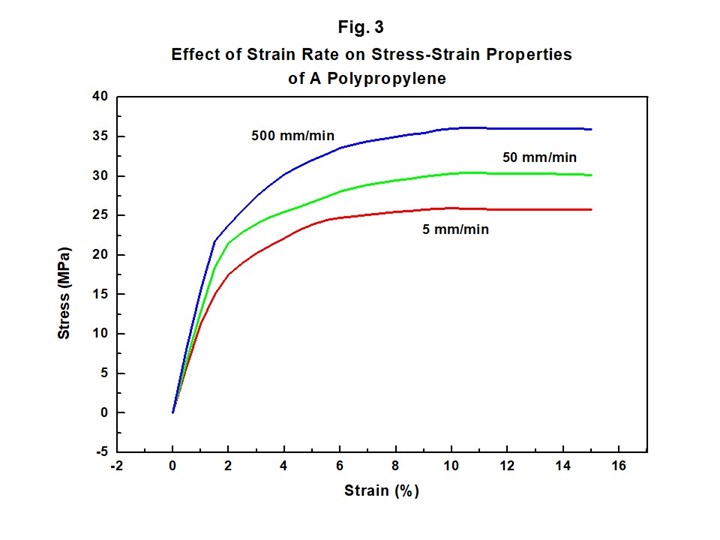
FIG 3 This shows results of varying strain rate for a PP. At higher strain rates we measure higher yield stress and tensile modulus.
Figure 3 shows this result for a polypropylene. As the strain rate increases we measure a higher yield stress and tensile modulus. What is not seen in this plot is the conclusion of the test represented by the strain at which the sample breaks. If it were displayed we would see that the material elongates to over 300% at 5 mm/min, 120% at 50 mm/min, and 30% at 500 mm/min. Higher ultimate elongation values are associated with increased toughness, so this provides us with another illustration of the trade-off between load-bearing properties and impact resistance. It also underscores the importance of making sure that the strain rate of the tensile test is specified when reporting the results.
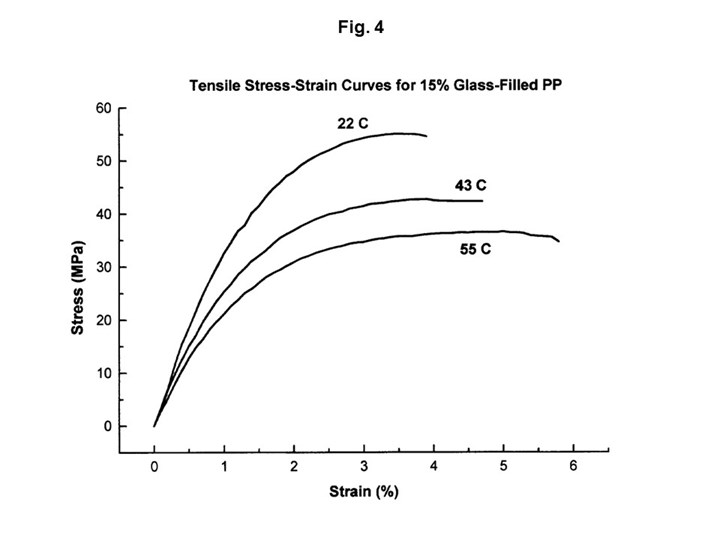
FIG 4 This shows tensile test results for another grade of PP (with 15% glass). Here the strain rate was held constant and the temperature was varied. As temperature increases, the strength and modulus of the material decline, mimicking the effects of changing strain rate.
Figure 4 shows the results of tensile tests performed on another grade of polypropylene. In this case the strain rate was held constant and the temperature was varied. As expected, as the temperature increases the strength and modulus of the material decline, mimicking the effects of changing strain rate. The equivalence of strain rate and temperature can be demonstrated by performing this simple exercise. Cover up the labels on the two graphs and then try to determine whether the variation in the curves was caused by a change in temperature or a change in strain rate. It is not possible. And just as we cannot tell the difference, neither can the polymer.
Both of these exercises demonstrate the equivalence of strain rate and temperature on the mechanical properties of polymers. Higher strain rates and lower temperatures have the same effect while higher temperatures and lower strain rates have the same effect. Now that we have established this additional implication of the time-temperature equivalence, we are ready to tackle the third axis of this picture, stress. And this we will do next month.
ABOUT THE AUTHOR: Michael Sepe is an independent materials and processing consultant based in Sedona, Ariz., with clients throughout North America, Europe, and Asia. He has more than 45 years of experience in the plastics industry and assists clients with material selection, designing for manufacturability, process optimization, troubleshooting, and failure analysis. Contact: (928) 203-0408 • mike@thematerialanalyst.com
Related Content
The Effects of Temperature
The polymers we work with follow the same principles as the body: the hotter the environment becomes, the less performance we can expect.
Read MorePrices for All Volume Resins Head Down at End of 2023
Flat-to-downward trajectory for at least this month.
Read MoreThe Effects of Time on Polymers
Last month we briefly discussed the influence of temperature on the mechanical properties of polymers and reviewed some of the structural considerations that govern these effects.
Read MoreHow to Optimize Injection Molding of PHA and PHA/PLA Blends
Here are processing guidelines aimed at both getting the PHA resin into the process without degrading it, and reducing residence time at melt temperatures.
Read MoreRead Next
The Effects of Temperature
The polymers we work with follow the same principles as the body: the hotter the environment becomes, the less performance we can expect.
Read MoreThe Effects of Time on Polymers
Last month we briefly discussed the influence of temperature on the mechanical properties of polymers and reviewed some of the structural considerations that govern these effects.
Read More.jpg;width=70;height=70;mode=crop)
