Rheology is the science related to how materials flow. Its usefulness is well known by most extrusion and injection molding equipment designers. For example, viscosity curves as a function of shear rate and temperature are used to calculate pressure drop in an extrusion die and, ultimately, to dimension the flow channel for a particular set of processing conditions.
Many processors are still mystified by rheology. Let’s try to dispel the mystery by showing how the wealth of information it provides can be used by processors to solve real-world production problems.
Shear Thinning and Melt Temperature
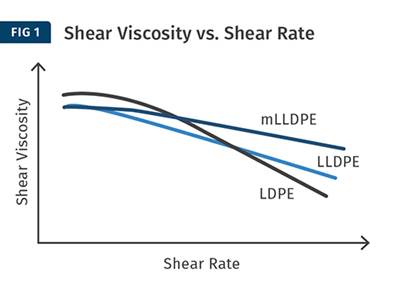
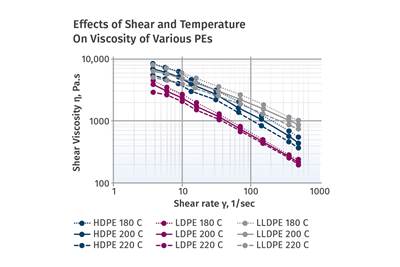
Polymer melts are non-Newtonian fluids and exhibit a decrease in viscosity at an increasing shear rate. This viscosity decrease is called shear thinning, and it depends on polymer structure and molecular-weight distribution (MWD). For instance, a linear polymer like LLDPE will tend to shear-thin much less than a polymer with long-chain branching like LDPE. Understanding how a given polymer grade shear-thins can help processors understand many extrusion issues, and therefore it is critical to learn how to “read” a viscosity curve. In particular, the shape of the viscosity curve as a function of shear rate has an effect on the flow distribution from an extrusion die, the melt pressure through a die, and melt temperature at the tip of a screw.
To illustrate the last point, we calculated melt-temperature predictions with Computational Fluid Dynamics (CFD) in the mixing section of a single-screw extruder for two polymers with comparable viscosity, but vastly different shear-thinning behaviors. The screw and its mixer (Fig. 1) were designed and optimized for LDPE, which is a very shear-thinning polymer due to long-chain branching and broad MWD. Figure 2 shows CFD results for the LDPE grade; pressure through the mixer and resulting melt temperature change due to shear heating. The model predicts a pressure drop of about 6 MPa (870 psi), and a temperature increase of about 4° C (7.2 ° F) at the outlet of the mixer.
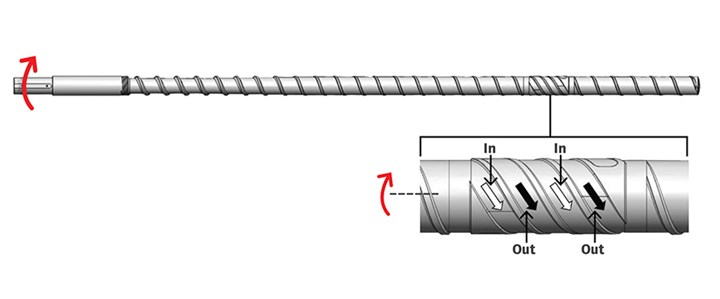
FIG 1 Extruder screw designed for LDPE, with one mixer having four helical channels with tapered depth.
Understanding how a given polymer grade shear-thins can help processors understand many extrusion issues, making it critical to learn how to “read” a viscosity curve.
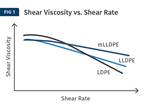
The same screw and mixer were used to process a metallocene LLDPE (mLLDPE) grade, with a melt-flow index (MFI) relatively comparable to that of the LDPE. Figure 3 shows a comparison of the viscosity curves for both grades with similar viscosity overall, but very different shear-thinning characteristics. Because mLLDPE shear thins less than LDPE, its viscosity at high shear rate is much higher. The mixer generates high shear rates (about 3000 sec-1 over the undercuts) at regular processing conditions. Consequently, Fig. 4 shows that the mLLDPE polymer flows very differently in the mixer and results in an unrealistic pressure drop of 19 MPa (2755 psi), and temperature increase of about 11° C (19.8° F).
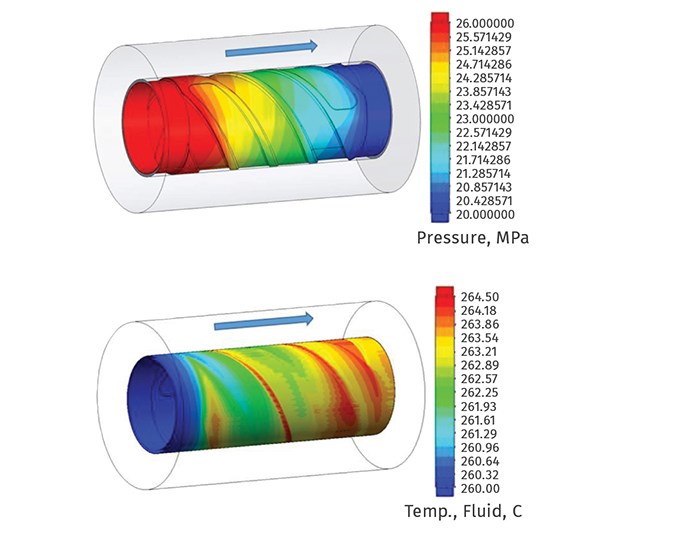
FIG 2 Predicted pressure field and melt temperature through the mixer for LDPE. The outlet
pressure was set to 20 MPa (2900 psi) and the inlet melt temperature to 260 C (500 F).
This example illustrates that it is important to know the shape of the viscosity curve in the extrusion process and when dealing with issues of controlling the melt temperature. Shear heating is driven by viscosity and shear rate. The shear flow in extruder screws generates a substantial contribution to the melt temperature, the other factor being the conductive heat transfer from the extruder barrel. Changing resins with significant differences in shear thinning, even with similar MFI values and from the same “family,” like these polyethylene grades, can lead to significant differences in melt temperature and pressure and extruder torque at the same processing conditions.
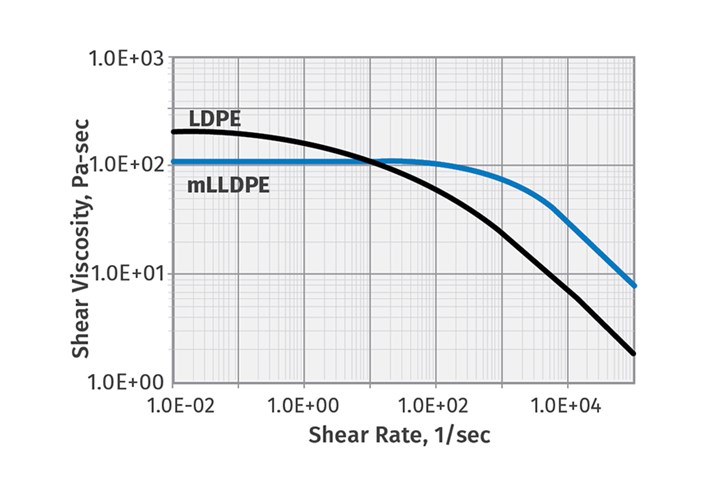
FIG 3 Viscosity curves for LDPE and mLLDPE.
Because mLLDPE shear-thins less than LDPE, its viscosity at high shear rate is much higher.
Melt Flow Instability
In this case, a sample of highly filled polymer of unknown composition was analyzed to design a die for a relatively thin sheet with process parameters specified by the processor. Because of the nature of the filled compound, a capillary rheometer was chosen to investigate the material.
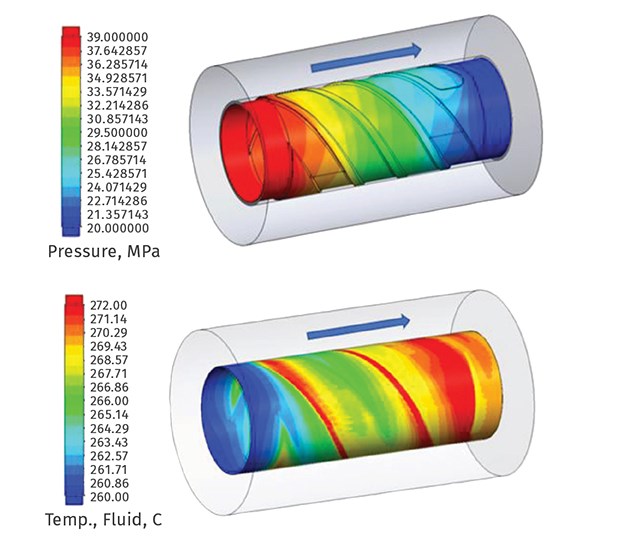
FIG 4 Predicted pressure field and melt temperature through the mixer for mLLDPE.
Outlet pressure was set to 20 MPa (2900 psi) and the inlet melt temperature is set to 260 C (500 F).
With this technique, the pressure drop in a capillary die is measured for a set of flow rates. Knowing the capillary geometry, the pressure drop can be converted into shear stress at the capillary wall, and the flow rate can be converted into apparent shear rate. Viscosity can be determined by the ratio of shear stress to shear rate. In this example, the measurements were performed from high shear rates to low shear rates. Figure 5 shows the recorded pressure measurements over time. On the same graph, we plotted the equivalent apparent shear rates.
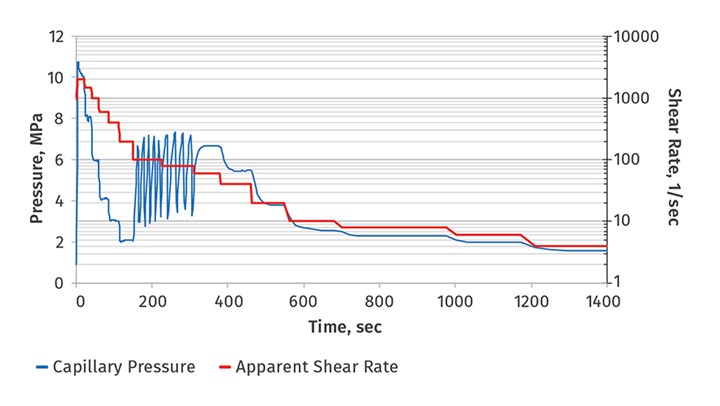
FIG 5 Pressure measurements as a function of time at several different shear rates
from a capillary rheometer, showing severe flow instability for a highly filled compound.
The pressure measurements show very interesting patterns:
- For high apparent shear rates from 2000 to 200 sec-1, the flow is slightly erratic and unstable as shown by the slight instability in pressure measurements.
- For apparent shear rates of 100 and 80 sec-1, we observed a stick-slip phenomenon on the extruded strands, which corresponds to the massive pressure oscillations recorded with the rheometer.
- At apparent shear rates of 60 sec-1 and below, the flow and the pressure measurements are completely normal.
In this example, we were able to establish a stable/unstable flow processing window for this atypical material. Based on the die gap and requested outputs, we were able to make recommendations ahead of the equipment being manufactured. However, if a flow instability is observed in a given process, this type of analysis can be done to establish a stable/unstable flow processing window.
Thermal Degradation
Some materials are prone to degradation during extrusion, due to temperature sensitivity, oxygen or moisture content, or other factors. PVC, PVdC, TPUs, some nylons and polyesters are examples of materials that can exhibit thermal degradation issues. Rheology can be used to determine how thermally stable a specific material is in relation to a process.
In addition, it may be useful to determine the specific process residence time. Figure 6 shows a third example, involving nylon film extrusion. In this process, the material was run a little too hot, and gels were visible in the film. To confirm the effect of temperature on material stability, we ran time-sweep measurements at 250, 265 and 280 C for 45 min in a rotational rheometer. We found that the viscosity of this material increased over time at all three temperatures, which indicates a tendency for the material to crosslink, even in an inert nitrogen atmosphere. While viscosity growth is detected over time for all three temperatures, it is clear that the growth rate is dramatically increased at 280 C, indicating that perhaps it would be good to avoid running the material at this temperature or higher.
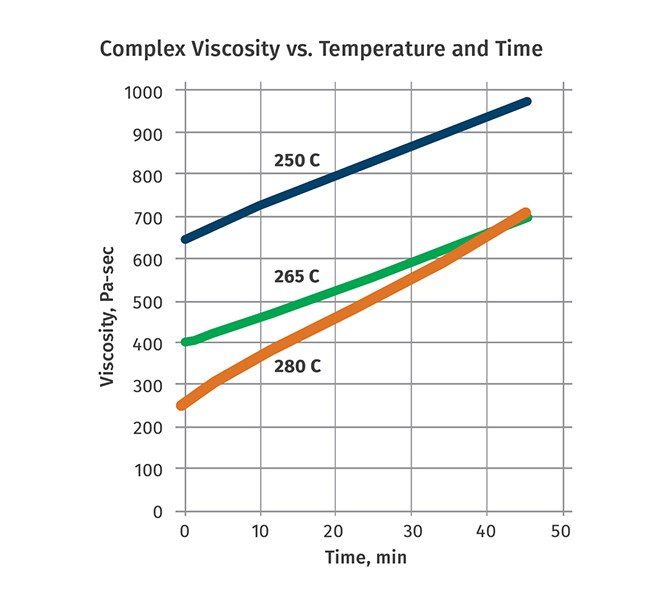
FIG 6 In these rotational viscometer experiments with a nylon 6 film resin, viscosity tended to increase over time at all temperatures, due to gels; but the increase was more rapid at the highest temperature, suggesting an upper limit to the processing window for this resin.
Rheology can be used to determine how thermally stable a specific material is in relation to a process.
Rheology is usually associated with viscosity curves for a given material. However, it can provide so much more useful information that is critical to equipment designers, product development engineers, and processors. Through some examples, we illustrated how shear-thinning can impact extrusion performance and particularly melt quality and melt temperature for a given extruder configuration.
Another aspect where rheology can be used to troubleshoot an extrusion process is when dealing with melt-flow instabilities, such as melt fracture. This was shown in an example of highly filled formulation for which a die was to be designed and manufactured. Without this characterization, costly design mistakes would probably have occurred. Finally, understanding the thermal stability of a material under specific conditions (type of atmosphere, temperature, and time) is possible through time-sweep experiments. The data will help determine the extrusion processing window of temperature or residence time.
ABOUT THE AUTHOR: Olivier Catherine has nearly 20 years of experience in plastics as an expert in polymer processing, rheology and process modeling. He is currently corporate scientist for Cloeren Incorporated in Orange, Tex., where he focuses on die designs and implementing new rheological tools and flow-simulation capabilities. Catherine graduated in France from Cemef/Mines Paris Tech in 2001, earning an M.S. in Materials Science. Contact: 409-951-7632; ocatherine@cloeren.com; cloeren.com.
Related Content
How to Estimate and Control Head Pressure
You rightfully worry about melt temperature, but don’t overlook head pressure, because the two are closely linked and will influence line performance.
Read MoreHow Much L/D Do You Really Need?
Just like selecting the extruder size and drive combination, the L/D should be carefully evaluated.
Read MoreCooling the Feed Throat and Screw: How Much Water Do You Need?
It’s one of the biggest quandaries in extrusion, as there is little or nothing published to give operators some guidance. So let’s try to shed some light on this trial-and-error process.
Read MoreSpecialty Purging Compounds Optimize Color and Material Changeovers
Selecting of the correct purging compound can speed up material and color changeover time and reduce scrap. You’ll even save on material.
Read MoreRead Next
Coextruding Blown Film Needs Deeper Understanding of Resin Rheology & Die Design
More film processors are investing in lines with nine or more layers. With more resin possibilities and combinations coming into play, it’s important to learn more about material rheology and compatibility, as well as die design.
Read MoreUnderstanding Viscosity in Extrusion
Both the power-law coefficient and the consistency index must be considered to calculate viscosity.
Read MorePart Two: Determining Viscosity Data Using a Slit Die Viscometer
Using a slit-die viscometer connected to a lab extruder can generate accurate data on melt viscosity at various shear rates and different temperatures—a useful QC tool in processing.
Read More








.png;maxWidth=300;quality=90)


