
Want to Slash Energy Costs? Learn How to Measure & Manage Them
Price pressure from consumers and rising energy costs have increased the importance for molders to reduce energy consumption, measured in kWh/kg of resin processed.

ENERGY EFFICIENCY
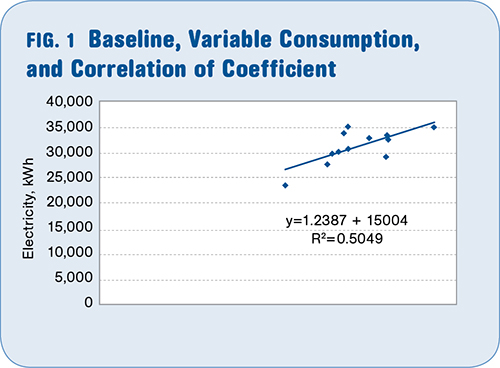
The baseline is considered to be the energy overhead and needs to be tackled first. If the trend line here is extended such that it crosses the Y axis, the intercept point of 15,004 kWh is the baseline of this operation.
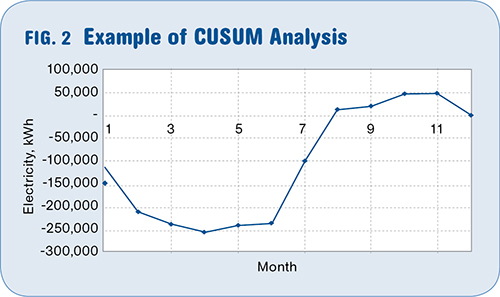
In a CUSUM analysis, a change in the slope of the graph usually suggests a change in the operations that must be evaluated. A downward trend indicates the actual energy consumption is less than the predicted energy consumption.
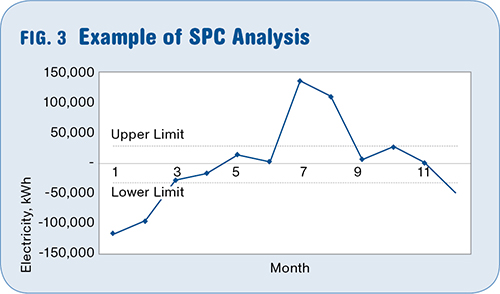
On a control chart, upper and lower limits are set, based on historical consumptions, and current consumption is viewed against the set limits. If consumption in one month falls beyond the upper limit (if not volume or product mix related), then a corrective course of action should be taken immediately.


Price pressure from consumers and rising energy costs have increased the importance for molders to reduce energy consumption, measured in kWh/kg of resin processed. Energy is a cost that must be monitored and controlled, and when done effectively it can lead to improved financial performance.
Adding the latest energy-efficient technology and equipment is not the only way to reduce energy consumption. While it’s true that today’s technology uses less energy, it is also critical to have a sustainable approach to reducing energy usage in the long run. Therefore, the preferred and more effective method takes a holistic approach to reducing and sustaining energy consumption in a molding operation. In this article we’ll discuss the key energy measurements that will allow you to craft a targeted energy-reduction plan, and how you can sustain those savings over time.


ENERGY ANALYSIS
Before deciding where to direct your energy-reduction efforts, it’s best to begin with an in-depth energy audit of your facility. Upon completion of this review, you should be able to create a plan that includes a detailed set of improvement goals for the short and medium term. Creating a plan and implementing it is only part of a complete energy-reduction strategy however; energy management must be an ongoing effort, and even after measures have been put in place, molders need to continue to focus on ensuring the sustainability of the savings achieved.
The first step in devising an effective energy-management plan is to identify baseline and variable consumption. Compare your monthly resin consumption data in kg or lb to the kWh usage for each corresponding month. This analysis provides three important types of information. The baseline, variable consumption, and coefficient of correlation (R2).
The baseline is essentially energy “overhead” that comes from non-production-related activities such as lengthy and inefficient mold changes or parking-lot lights staying on at nights. The baseline must be tackled first. If the trend line shown in Fig. 1 is extended to the left until it crosses the Y axis, the intercept point is the baseline of this operation. Best-in-class molders have a baseline between 10% and 12% of their total energy consumption. The slope of the graph represents the overall plant variable consumption.
These are some examples of contributors to the baseline and variable consumption:
•Thermal contamination of the conditioned air. Inefficient use/misuse of HVAC system.
•Leaving a machine’s heat, motor, and conveyors on when a machine is down.
•Leaking air compressors.
•Lack of variable-frequency drive (VFD) motors.
•Partially loaded motors.
•Inefficient light fixtures.
•Low operational efficiencies.
•Low throughput (cycle and cavitation) efficiencies.
•Un-optimized process parameters.
•Un-optimized dryers.
Coefficient of correlation (R2) indicates how direct the relationship is between energy usage and resin consumption for each month. A high value of R2 (1 being the maximum) means a good correlation between energy usage and resin consumption.
Once you’ve determined your baseline and variable consumption, it’s important to take a look at your facility as a whole to understand which pieces of equipment are the biggest consumers of energy and what to spend your energy-reduction budget on first. One of the most common mistakes molders make is jumping straight into an action plan without first gaining a proper understanding of where, when, and how much energy is being used. This will help avoid spending time, money, and resources on items that may not be the biggest consumers of energy.
In addition to determining where the most energy is being used, it’s critical to analyze when and how much energy is used. Most electricity suppliers provide “demand profile” graphs via a free login web access to your account. Analysis of these graphs provides valuable information that will help reduce overall plant energy consumption. We have seen cases where a plant had a long weekend plant shutdown yet was still consuming around 300 kW. Further investigation revealed that certain equipment was left on by mistake.
Many areas within a molding operation should be examined to find energy-reduction opportunities. For simplicity of analysis, we recommend breaking your search down into the following four categories:
1. Primary equipment (injection and blow molding machines, extruders, filling lines, and secondary operations such as lining, packaging, etc.).
2. Auxiliary equipment (dryers, grinders, dehumidifiers, etc.).
3. Process services (chillers, towers, air compressors, etc.).
4. Building and infrastructure (HVAC, lighting, etc.).
Injection molding machines are typically the most energy-consuming items in a facility. The biggest energy-reduction opportunity with regard to injection machines (as with most other equipment) comes from running the machine as efficiently and as close to its design conditions as possible.
A recent case study on a PET preform molding machine showed that optimizing processing parameters such as screw speeds, transfer speed, barrel heats, and transfer packing pressure reduced energy consumption by 7% without affecting part quality or cycle time. Using a real-time process-monitoring system, such as Husky’s Shotscope NX, allows the operator to continually monitor process conditions and ensure they are being optimized.
With regard to overall operations, maximizing Overall Equipment Efficiency (OEE) also reduces energy consumption (measured in kWh/kg). Unplanned downtime affects both OEE and energy consumption, as it requires more energy-intensive machine startups, at unforeseeable times, when energy can be more expensive.
SUSTAINABILITY: THE M&T PROCESS
Once you’ve identified and addressed key energy areas, it’s important to focus on the sustainability of those efforts. Our recommended approach is to utilize sub-meters for “metering and targeting” (M&T), in addition to implementation of policies and procedures to measure, set targets, and monitor energy-related key performance indicators. This approach will help to sustain the energy reductions achieved as you continue to pursue additional reduction opportunities.
M&T is a very important tool for operations managers. The fundamental principle of M&T is that energy and other utilities are direct costs that should be monitored and controlled in the same way as other direct, production-related costs.
The M&T process begins with dividing a plant into energy departments. For additional control, energy may be monitored in specific areas within a department. Managers of each area are responsible and accountable for energy use. Energy usage should be reviewed regularly against the standards and budgets, similar to other operational key performance indicators.
For each section of the plant monitored, such as production, mechanical systems, or downstream secondary operations, a suitable base point is needed against which to assess performance. A performance standard can then be derived from historical data that takes into account factors that significantly affect efficiency. Understanding reasons for and timing of the peaks (i.e., midnight, morning, noon) also helps in reducing consumption through the modification of operating practices. For example, if the analysis indicates occurrence of a peak at 10 AM every day, then certain equipment (grinders, etc.) potentially could be turned off and run during off-shift times when power is less expensive.
Types of data analysis could include the folowing:
Trend analysis: This can help identify the baseline and variable consumption and coefficient of correlation (R2). These three key indicators should be monitored and benchmarked monthly.
CUSUM analysis: This is a powerful tool, as a change in the slope of the graph indicates a change in operations that must be evaluated. A downward trend indicates the actual energy consumption is less than the predicted energy consumption. See Fig. 2.
SPC analysis: This is very similar to what is done in a QC/QA environment. Upper and lower statistical limits, based on historical consumption, will be set and current consumption will be viewed against those limits. Should consumption of one month fall beyond the upper limit (if not related to volume or product mix), then corrective action should be taken immediately. See Fig. 3.
Benchmarking: The following metrics could be used for benchmarking:
•Site-specific energy consumption (kWh/kg).
•Plant energy use (kW/yr)
•Plant energy intensity (kW/m2/yr)
•Load factor (%) = (kWh/month) ÷ kW (demand) x hours in billing period. LF provides direction on what to focus on. High LF (above 0.7) indicates a need to focus on reducing total consumption, not demand.
Before implementing any energy-reduction plan, it’s important to take time at the outset to gain a proper understanding of your facility and where the most energy is being used. From there, you can then identify the priority areas as well as industry averages and what your particular targets will be.
Implementing an effective energy reduction plan takes time and effort and is only part of an overall strategy. Sustaining the energy savings you achieve initially takes an ongoing commitment from management if there is hope to continue those savings over time. With years of experience in offering energy-reduction practices through its Total Energy Management program, Husky offers a range of consulting services and programs aimed at supporting injection molders in their pursuit of greater operational efficiency, strong financial performance, and social responsibility.


Related Content

The Strain Rate Effect
The rate of loading for a plastic material is a key component of how we perceive its performance.
Read More
Improve The Cooling Performance Of Your Molds
Need to figure out your mold-cooling energy requirements for the various polymers you run? What about sizing cooling circuits so they provide adequate cooling capacity? Learn the tricks of the trade here.
Read More
Know Your Options in Injection Machine Nozzles
Improvements in nozzle design in recent years overcome some of the limitations of previous filter, mixing, and shut-off nozzles.
Read More
Solve Four Common Problems in PET Stretch-Blow Molding
Here’s a quick guide to fixing four nettlesome problems in processing PET bottles.
Read MoreRead Next

External Benchmarking of Injection Molding Energy Efficiency
In April, we discussed the use of the slope of the curve of process energy consumption versus production volume for internal benchmarking of energy efficiency.
Read More
What’s Your Process Energy Fingerprint?
As we discussed in last month’s column, your plant’s “energy fingerprint” is composed of the base load and the process load.
Read More
Why (and What) You Need to Dry
Other than polyolefins, almost every other polymer exhibits some level of polarity and therefore can absorb a certain amount of moisture from the atmosphere. Here’s a look at some of these materials, and what needs to be done to dry them.
Read More