
Part Two: Determining Viscosity Data Using a Slit Die Viscometer
Using a slit-die viscometer connected to a lab extruder can generate accurate data on melt viscosity at various shear rates and different temperatures—a useful QC tool in processing.
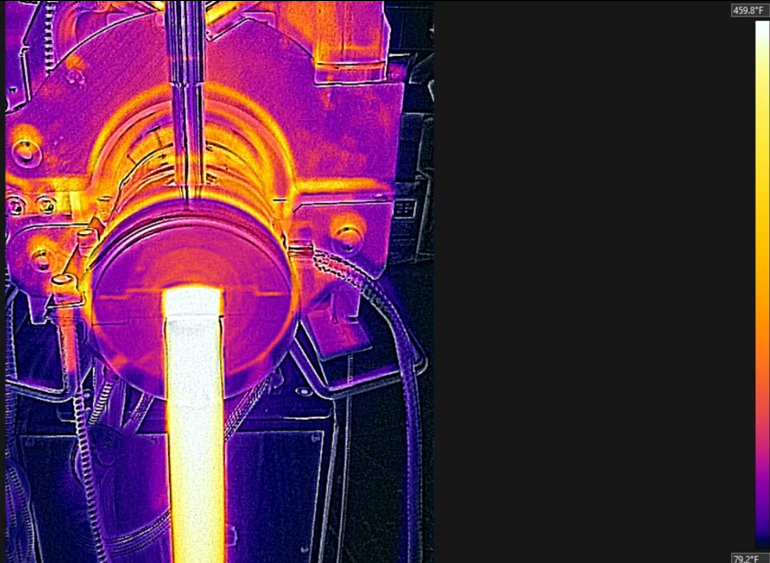
Infrared photo of slit die shows that the melt emerging from the die is much hotter than the die or the exposed stem of the temperature transducer.
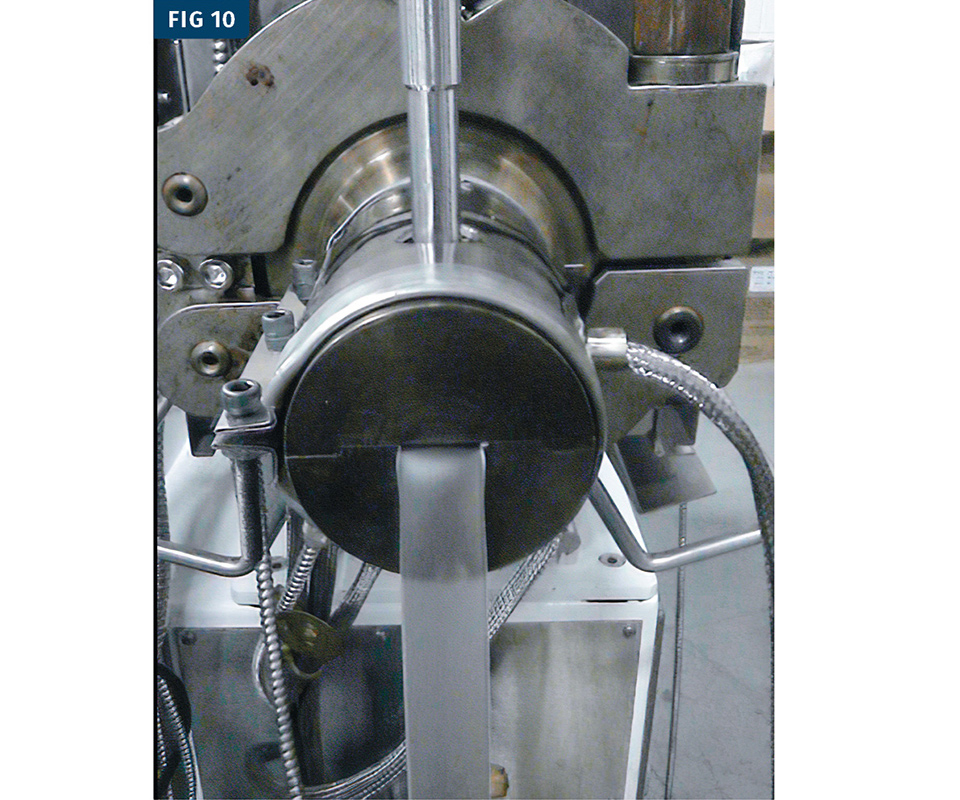
Actual photo of slit die. Since the molten polymer emerging is transparent, an IR sensor measures more than just the surface temperature of the melt, but senses temperature some distance into the melt. That would not be the case if the melt solidified and became opaque.


Data on melt viscosity at various shear rates is useful in most extrusion operations. Such data provides a valuable QC tool. Viscosity data is required in screw and die design and also in computer simulation of the extrusion process. Proper selection of an extruder screw or extrusion die requires knowledge of viscosity as a function of shear rate. Further, instabilities such as melt fracture can be quantified and predicted if viscosity data is obtained from a capillary rheometer or slit-die viscometer.
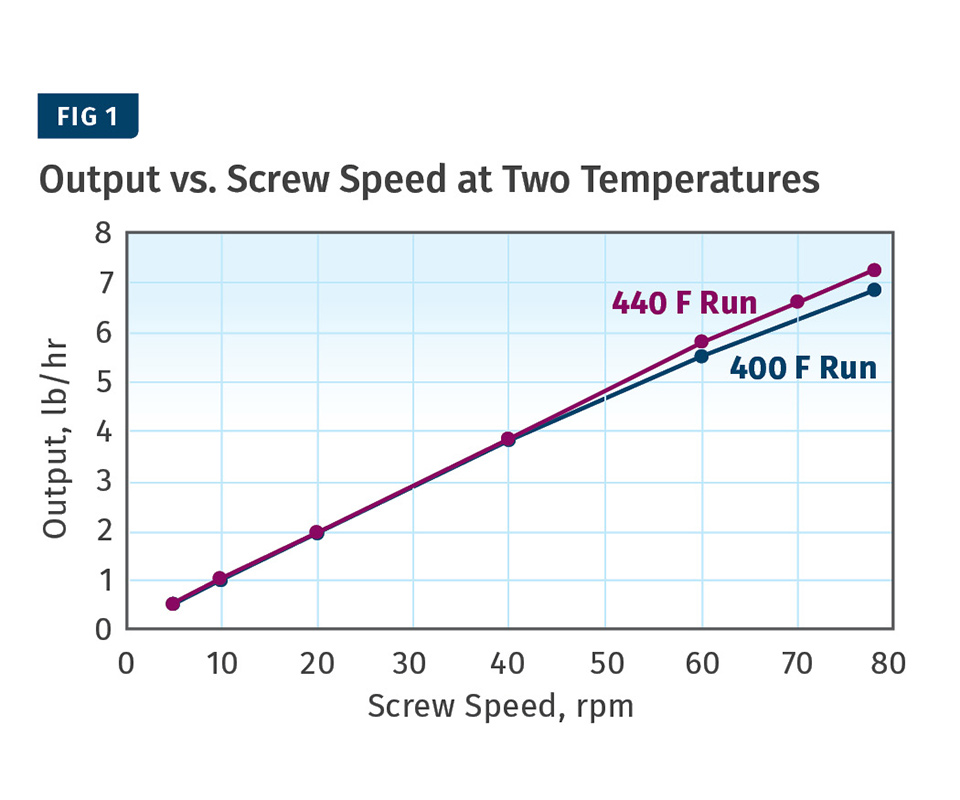
In part one, we showed how we generated data on viscosity vs. shear rate at two temperatures on 0.5 MI HDPE 273-83. At this point, it is useful to analyze some performance characteristics of the extruder. Figure 1 shows the extruder output versus screw speed for runs at 400 F and 440 F. The output is close to proportional to the screw speed. At the lower screw speeds there is little difference in output between the two temperatures. However, at the higher screw speed there is a noticeable difference, with the 440 F run having higher output.


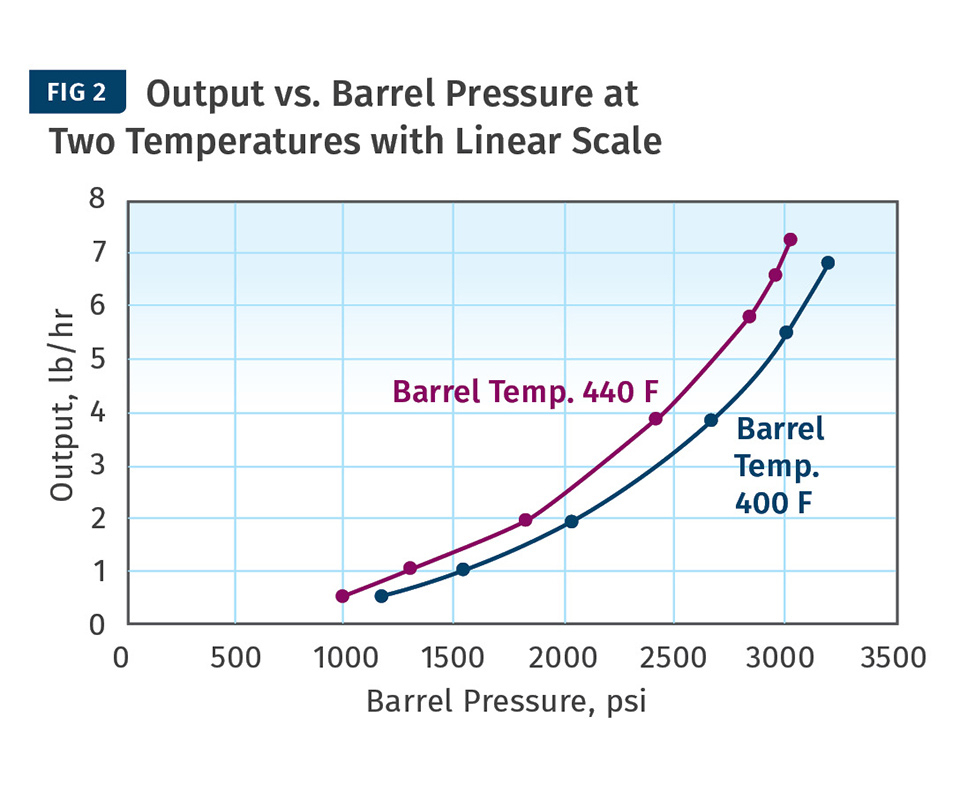
The output at 440 F is higher because the die-flow resistance reduces at higher temperature. Since the melt viscosity at 440 F is lower than at 400 F, the extruder discharge pressure at 440 F will be lower and, as a result, the extruder output will be higher. This is confirmed in Fig. 2, showing the extruder output versus barrel pressure.
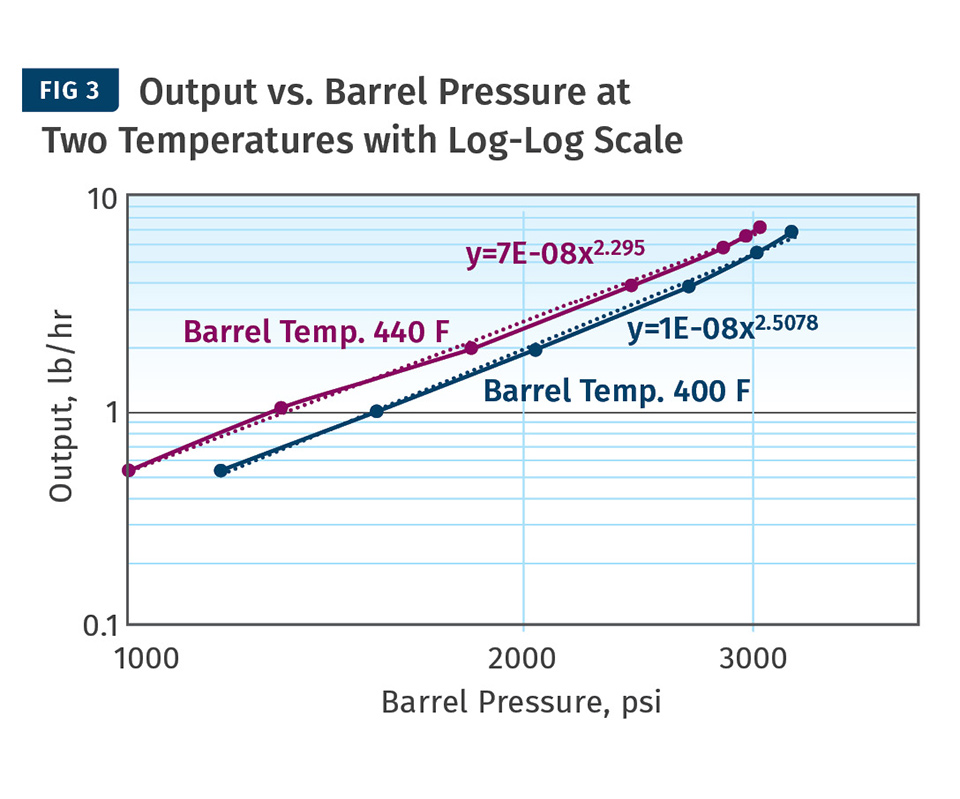
Figure 2 shows that at a certain output, the barrel pressure at 440 F is significantly lower than at 400 F. The output versus pressure shows a distinct non-linear behavior when the data is plotted on a double linear scale. However, when the data is plotted on a log-log graph the data fits well with a straight line (see Fig. 3).
The power-curve fit is shown in Fig. 3 for both temperatures. The exponent of the power-curve fit is 2.5078 at 400 F and 2.295 at 440 F. For a power-law fluid, the exponent is equal to the reciprocal power-law index (1∕n). This means that the power-law index at 400 F is 0.400 and 0.436 at 440 F. At 440 F the power-law index n = 0.436 from the output-vs.-pressure graph compares with n = 0.440 obtained from the viscosity-vs.-shear-rate graph. At 400 F the power-law index n = 0.400 from the output-vs.-pressure graph compares with n = 0.466 obtained from the viscosity-vs.-shear-rate graph. The power-law values at 440 F are reasonably close; at 400 F the values are farther apart.
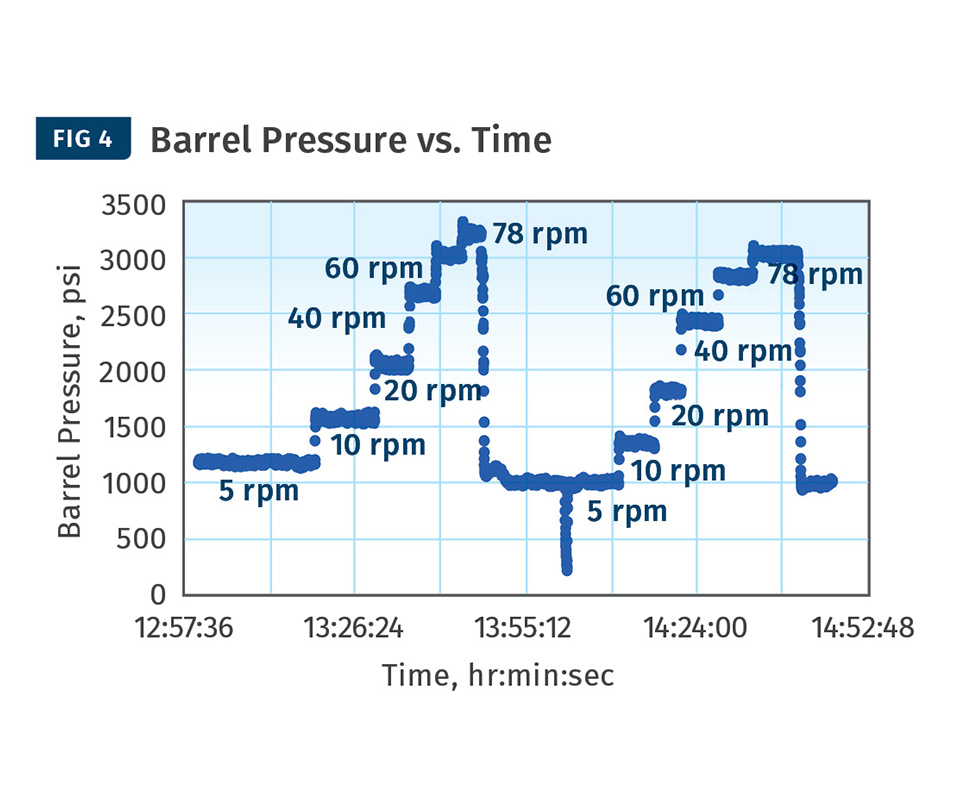
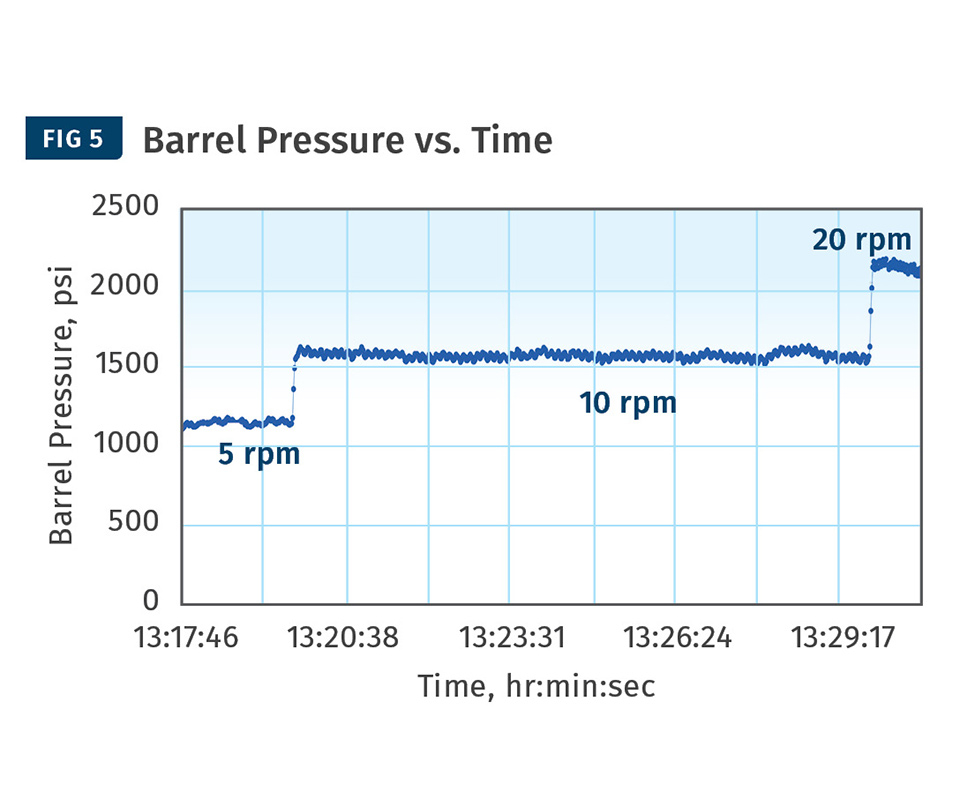
Figure 4 shows barrel pressure versus time over a 2-hr period. Over this period the screw speed was changed from 5 to 78 rpm twice. The graph shows that the barrel pressure reacts quickly to a change in screw speed. Figure 5 shows the same barrel pressure versus time over a 13-min period.
Within this period the screw speed was increased from 5 to 10 rpm at about 13:20 and from 10 to 20 rpm at about 13:30. This graph shows that the barrel pressure increases to its new level in about 10-20 sec.
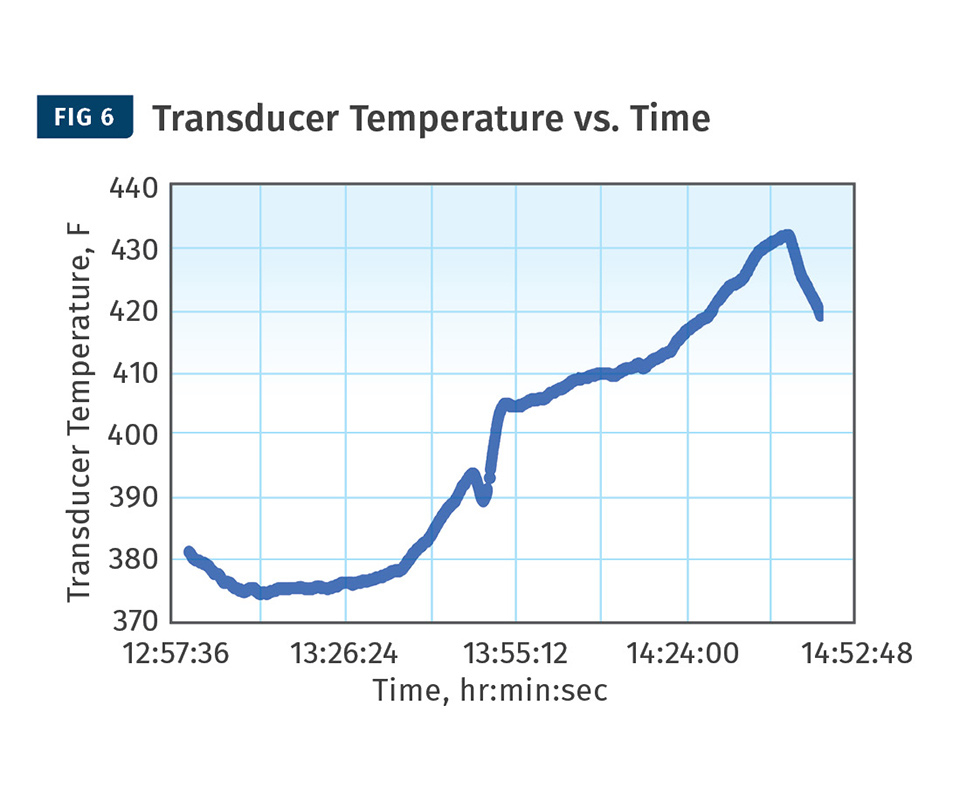
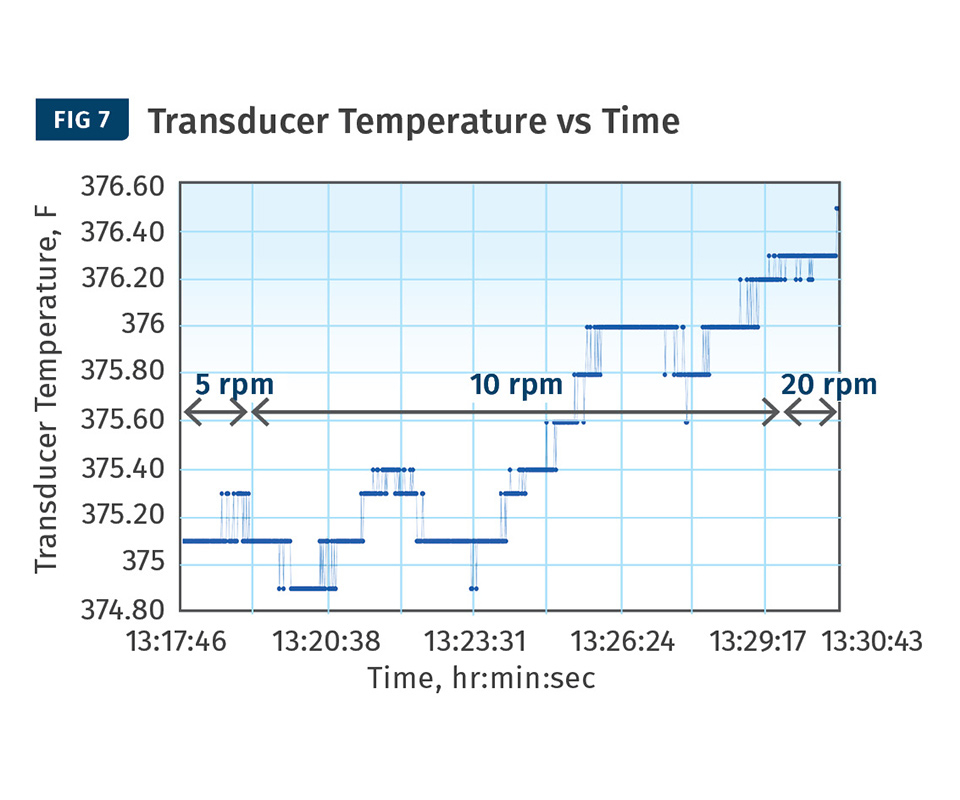
The reaction of transducer temperature to a change in screw speed is much slower, as shown in Fig 6. The transducer temperature clearly does not respond quickly to changes in screw speed as compared with the barrel pressure (see Figs. 6 and 7). In fact, there is no sign of the transducer temperature leveling off during the 2-hr span of the extrusion experiments shown in Fig. 6. Figure 5 shows the transducer temperatures over the same 13-min time period used in Fig 7.
This graph clearly shows that the transducer temperature does not level off within the 13-min time period. The 10-rpm screw speed was maintained for about 10 min. Over this period the transducer temperature does not reach a steady value. It is also clear that the transducer temperature is only shown in 0.1°F increments. This results in a typical staircase pattern. Clearly, this is an artificial pattern caused by the lack of resolution. It should be possible to achieve a resolution of 0.01°F or less.
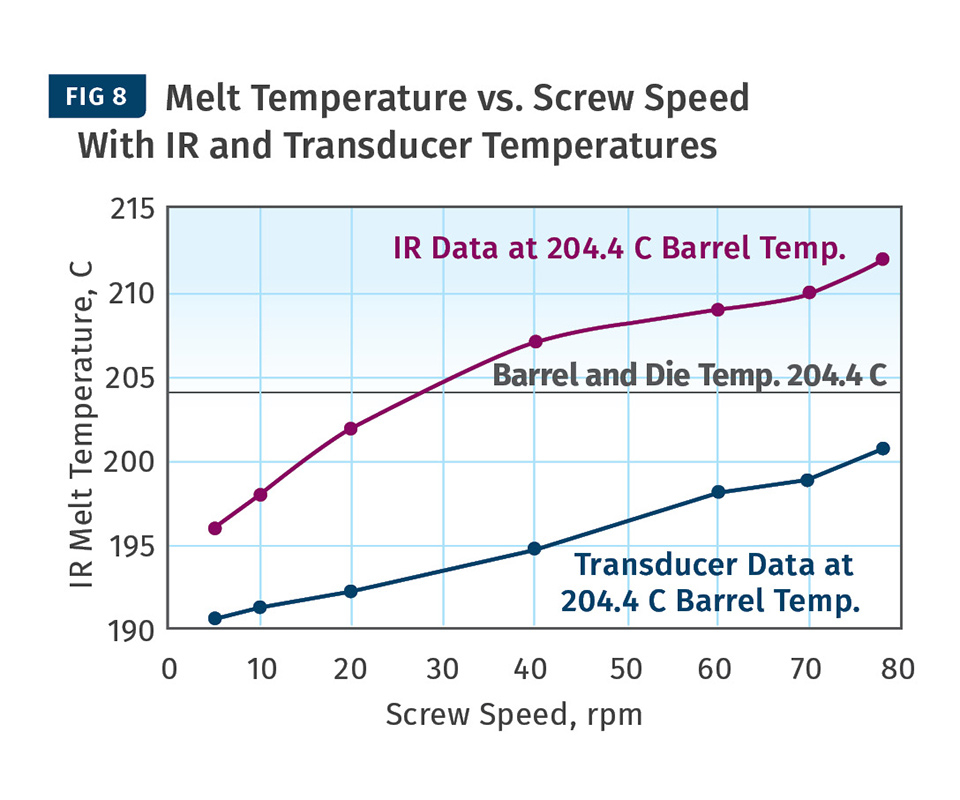
The melt temperature was measured using an infrared thermometer (Raytek MiniTemp MT6). The emerging extrudate was measured about 5 mm from the die exit. Figure 8 shows the melt temperature measured with IR vs. screw speed. The transducer temperature is shown as well. The barrel and die temperatures were set at 400 F (204.4 C) in these measurements.
The graph shows that the IR melt temperature is significantly higher than the transducer temperature. Unfortunately, the transducer temperature is often erroneously labeled as the “melt” temperature. This is a common mistake in the extrusion industry; it leads to incorrect interpretation of process data. This can hamper troubleshooting problems that deal with excessive melt temperature and degradation.
The transducer temperature is not the same as the melt temperature because the temperature sensor is not in direct contact with the polymer melt as is the case with an immersion melt-temperature sensor. The temperature sensor in a P∕T transducer is located inside the transducer itself. Therefore, the temperature that is measured is the transducer temperature, not the melt temperature. When there is no immersion melt-temperature probe available, the infrared thermometer provides a convenient and inexpensive alternative.
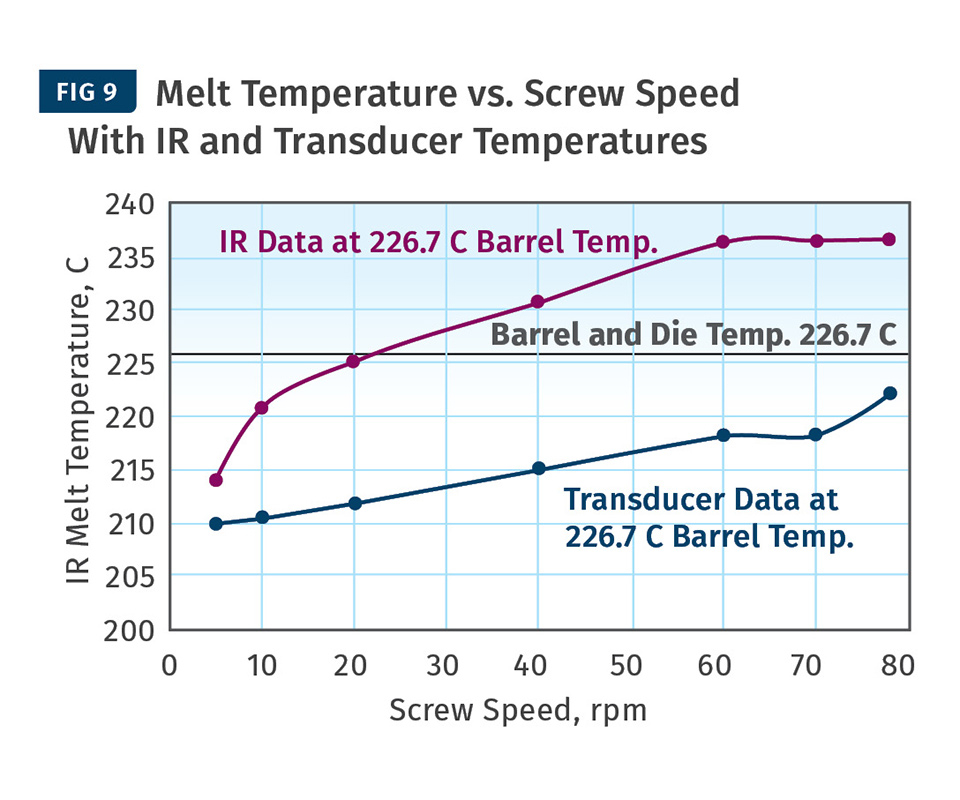
Figure 9 shows the melt temperature measured with IR versus screw speed; also shown is the transducer temperature. The barrel and die temperatures were set at 440 F (226.7 C) in these measurements.
Figures 8 and 9 show that the transducer temperature is below the barrel and die temperature for each screw speed. Clearly, the transducer temperature is an unreliable indicator of melt temperature.
Temperatures were also determined using an infrared thermal camera. The model used was a FLIR One Pro LT Pro-Grade, which plugs into a smartphone. The color scale represents the temperatures of the slit die and the emerging strip of polymer. The highest temperature is 459.8 F (237.7 C) and occurs right at the die exit where the molten strip of polymer emerges. Clearly, the IR melt temperature is substantially higher than the die temperature. The color of the strip of polymer indicates that it is still molten at the bottom of the picture.
This is confirmed in Fig. 10, showing the actual slit die with the emerging strip of polymer. The strip is transparent, indicating that the HDPE polymer is completely melted. When HDPE solidifies it becomes opaque and there is no sign that the strip is becoming opaque. Since the molten strip is transparent, the IR thermometer does not measure a surface temperature but an average temperature over a certain depth of the strip. As a result, the IR temperature is a reasonable reflection of the melt temperature. If the melt were opaque, the IR thermometer would measure only a surface temperature. In that case the IR temperature would be lower than the melt temperature because the surface temperature drops as soon as the extrudate leaves the die.
The IR image also shows that the exposed stem of the pressure transducer is at a relatively low temperature. This explains why the transducer temperature is lower than the die temperature in Figs. 8-9. The exposed part of the transducer is at about 40 C while the die temperature is 226.7 C. This means that there is a significant heat flux from the diaphragm end of the transducer to the exposed end. Since the transducer temperature sensor is some distance away from the diaphragm, the transducer temperature will be substantially lower than the actual melt temperature.
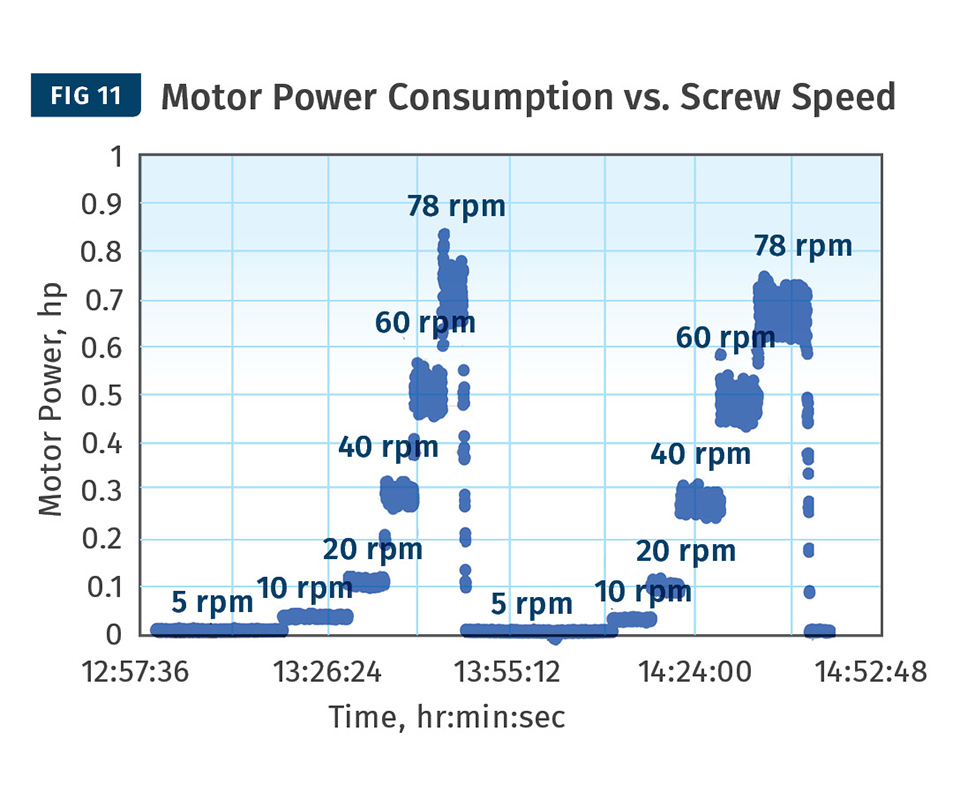
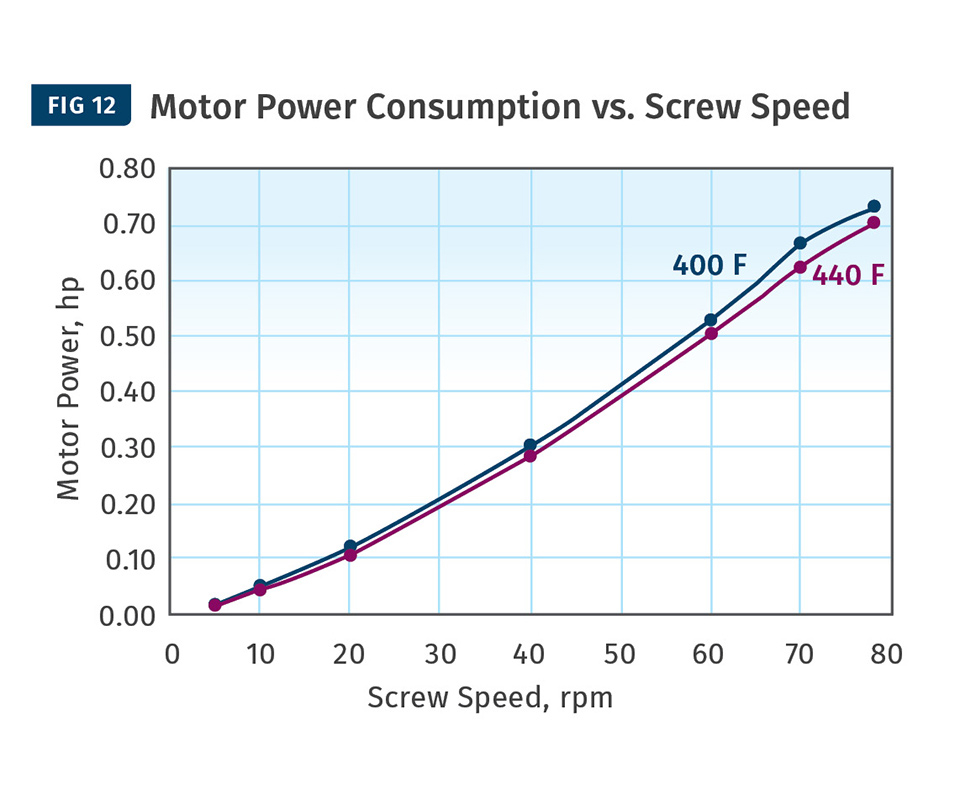
Figure 11 shows the motor power consumption from 12:43 to14:52. Clearly, the power consumption increases with screw speed. The barrel and die temperatures during the first period were set at 400 F, and at 440 F during the second period.
The motor power reduces slightly when the barrel and die temperatures are increased from 400 to 440 F. This is illustrated more clearly in Fig. 12, where the motor power consumption is plotted against screw speed. Motor power increases with screw speed because the shear rate increases with screw speed. Therefore, the shear stress and torque also increase with screw speed. At higher barrel and die temperature the shear stress and torque reduce because the melt viscosity reduces with temperature.
A more important measure of power consumption is the specific energy consumption, or SEC. This is the energy consumed per unit mass; it is an accurate measure of the frictional and viscous dissipation occurring in the extruder. The SEC is simply the motor power divided by the mass flow rate. The units of SEC are kWh∕kg in international units and hp-h∕lb in imperial units.
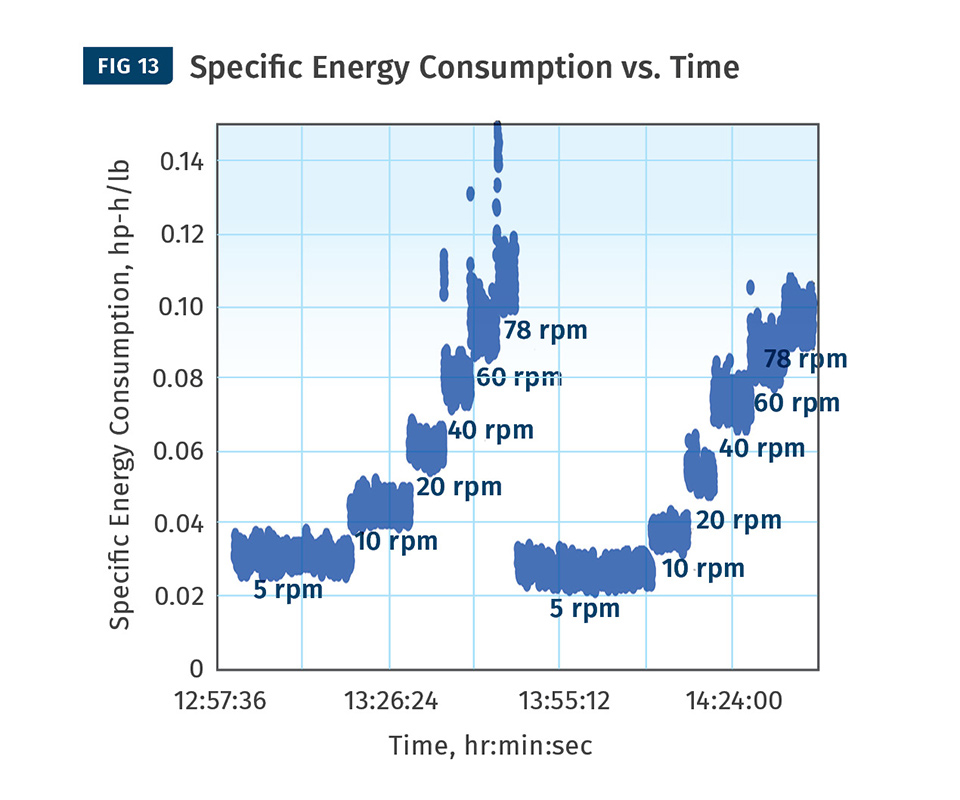
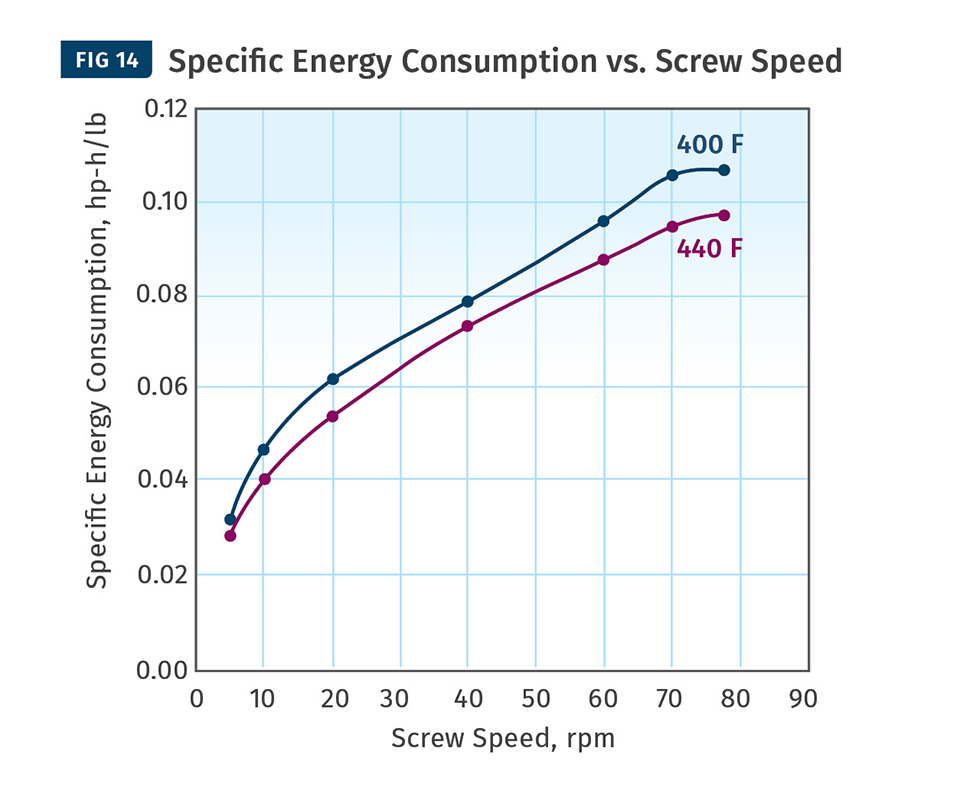
The motor power increases more than proportionally with screw speed. As a result, the SEC increases with screw speed, as shown in Figs. 13 and 14. Figure 13 shows the SEC vs. time. The SEC increases with screw speed. The specific energy requirement for HDPE is about 0.1 hp-h∕lb. This level of SEC is reached at about 60 rpm.
It can be seen in Figs. 8 and 9 that the melt temperature starts to exceed the barrel and die temperature around 20-30 rpm. This is a common situation in single-screw extruders. In many cases the melt temperature is higher than the barrel temperature. This is because viscous heating is greater than the level needed to keep the melt temperature at the barrel temperature.
In Fig. 14, the SEC at 440 F is lower than at 400 F barrel temperature because the melt viscosity at 440 is lower than at 400 F.
The slit-die viscometer allows accurate measurement of the shear viscosity. If a lab extruder is available, the slit die provides an inexpensive tool to measure melt viscosity. The cost of a slit die is about $5000; the cost of a capillary rheometer can range from $100,000 to $200,000. Even a combination of a lab extruder and slit die will be substantially less expensive than a capillary rheometer.
P∕T transducers do not provide a good measurement of the melt temperature. A separate melt-temperature measurement method needs to be available. This can be an immersion melt-temperature sensor or an infrared thermometer. The melt temperature inside the barrel or the die can be measured with a small sapphire window, which is commercially available.
The melt temperature increases with screw speed. Since the melt viscosity changes with temperature, the viscosity determination should correct for the changes in melt temperature. This correction was not performed in this study. However, it would not be difficult to include the temperature effect in the analysis.
The dynamic response of pressure to a change in screw speed is quite rapid—about 10-20 sec. The dynamic response of the transducer temperature is much slower. The transducer temperature does not level off even over a 10-min time period. That means that truly steady-state conditions may take much longer than it takes for the pressure to reach steady values.
EDITOR’S NOTE: Dr. Rauwendaal will present this findings during Plastics Technology’s Extrusion 2019 Conference, Sept. 17-19 in Rosemont, Ill. To learn more go to extrusionconference.com.
ABOUT THE AUTHOR: Dr. Chris Rauwendaal is a well-known author, lecturer, researcher, entrepreneur, and consultant in the field of extrusion. He holds numerous patents and has written more than 200 articles and seven books related to extrusion, mixing, injection molding, and statistical process control. A Fellow of the Society of Plastics Engineers (SPE), he is the developer of the CRD, VIP, and ASM mixing technologies that utilize strong elongational flow to improve mixing in extrusion and molding. Rauwendaal also developed the HHT (high-heat-transfer) extruder screw designed to improve cooling in foam tandem and other extrusion operations. In 1990 he founded and is still president of Rauwendaal Extrusion Engineering. Contact: (530) 269-1082; chris@rauwendaal.com; rauwendaal.com.


Related Content

Spiderless Pipe Die Touts Material Savings
Capable of providing a finished extrusion with OD from 2 in.-15 in.
Read More
Bonding, Sintering Tech Advances Metal Bonding for Mold, Die Components
NPE2024: Punch Industry USA exhibits P-Bas, intended to replace the use of 3D printers when producing mold and die components, as well as a variety of mold component supplies.
Read More
Is Your Die Flow Changing Despite Following All the Correct Formulas?
Maybe the problem is that you're starting up with a dry die. Here are tips to solve this issue.
Read More
Auto-Profile System for Blown Film Rotating Dies
NPE2024: New technology can slash gauge variation by 50%.
Read MoreRead Next

Advanced Recycling: Beyond Pyrolysis
Consumer-product brand owners increasingly see advanced chemical recycling as a necessary complement to mechanical recycling if they are to meet ambitious goals for a circular economy in the next decade. Dozens of technology providers are developing new technologies to overcome the limitations of existing pyrolysis methods and to commercialize various alternative approaches to chemical recycling of plastics.
Read More
Lead the Conversation, Change the Conversation
Coverage of single-use plastics can be both misleading and demoralizing. Here are 10 tips for changing the perception of the plastics industry at your company and in your community.
Read More