
Testing: Data Analysis Software for Color & Appearance Instruments
BYK Gardner’s new version smart-chart 7.1 supports wave-scan 3 and spectro2profiler color and appearance instruments.


An advanced version of a data analysis software for color and appearance instruments offered byBYK-Gardner, Columbia, Md., is newly available. The new smart-chart 7.1 software is designed to support the company’s wave-scan 3 family of instruments for orange peel control, and the spectro2profiler said to be a game changer and in the analysis of structured surfaces. The combination of color, gloss, 3D topography and 2D reflectivity in one easy to use instrument is a milestone in the objective measurement control of textured surfaces, according to BYK. Existing smart-chart users can download the new software version free-of-charge from the Support section on the BYK-Gardner website:
The new smart-chart software combines color and appearance data in one data analysis software and reportedly offers unsurpassed new functions to make users ready for efficient ‘Big Data’ management.


The measured data in smart-chart is saved in a SQL database which allows handling of large data sets over time. This reliable database type ensures full network and server compatibility. Data can be easily shared within the supply chain by extracting mini databases that can be sent by email and combined with other databases – see supplied parts before they even ship!
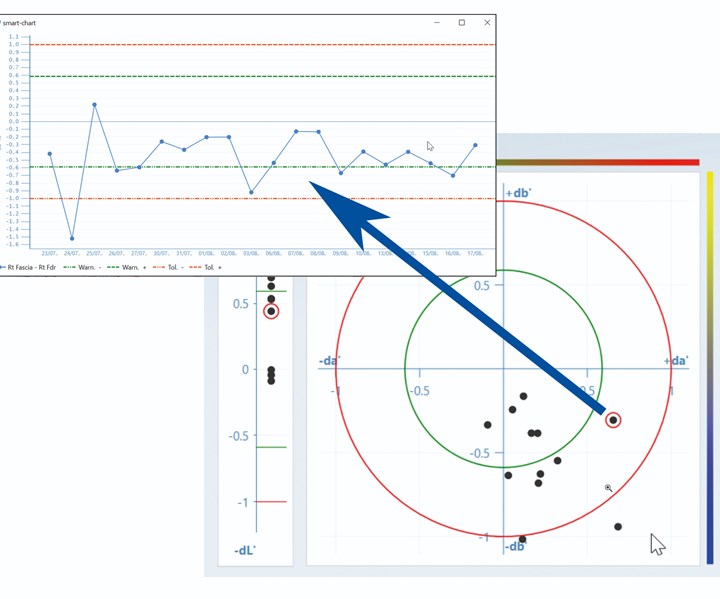
Brand new is the display of red and green tolerance lines. They are based on a company’s product specifications in standard management and can easily indicate a quality drift so that you are able to proactively take measures to avoid costly rejects.
The new drill-in function shows history trend of the last 20 measurements of the same model, color and painting line. Just click on any point in the scatter plot. A new ‘user management’ allows definition of various user levels with different access rights. Complete modules can be deactivated and deletion and editing of standards and measurement data can be disabled. The user permission can be password protected to make sure everyone has only access to the assigned modules and functions.
To manage your lab work the data can be saved in projects. For ease of operation multiple projects can be opened at the same time and an automatic saving and closing process can be defined – nearly error proofed! Samples can be organized into different groups e.g. all samples that are visually Pass – Fail – Borderline can be grouped together. For ease of visualization each group is displayed in one color in the graphs. An advanced sorting function based on all colorimetric values shown in the data table allows further analysis of measurement results.
Related Content
-
Injection Molder Changes Up Color Changes
An injection molder of trash cans, pallets, totes and other plus-size components, Rehrig Pacific’s machine fleet is composed of larger tonnage presses whose size makes material changes at the feed throat a potentially dizzying exercise.
-
Novel System Produces Color on Demand
Ampacet’s FluxQF technology features a quick-dispersion universal carrier with novel machinery that provides automated color blending in quantities down to 50 lb.
-
Tosaf’s Investments in North America Result in 40% Increase in Production Capacity
Backed by a global presence, Tosaf provides localized additive and color solutions, and services for the plastic industry in North America.


