
Is Your TCU Up to the Job? Mold Simulation Can Give the Answer
For realistic results, molding and cooling simulation must reflect the capabilities of the actual TCU to be used. Here’s how simulation can help determine whether your TCU is up to the job.


In injection molding, we usually control the mold at a fixed temperature by making coolant flow continuously through the mold. If the coolant flow is not sufficient, or the coolant temperature is not as expected, the mold won’t be kept at the desired temperature. Manufacturers of mold-temperature controllers (temperature-control units, or TCUs) calculate the appropriate specifications for their equipment according to the size of the mold and the part. However, it can be a challenge for engineers and analysts using molding and cooling simulation software to take into account the actual performance of a TCU. In this article, we’ll share principles for using CAE simulation software—in this case, Moldex3D—to evaluate the performance of TCUs.
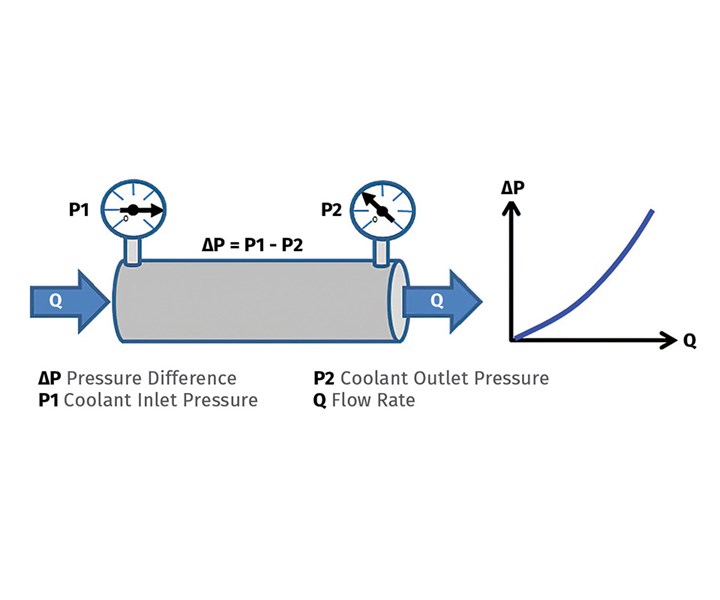
FIG 1 The relationship of cooling-channel flow rate and pressure difference.


Relation Between Flow & Pressure
In Moldex3D’s flow-analysis settings, users can apply two types of boundary conditions for cooling channels: flow rate and pressure. When the coolant flows through the cooling channel, the flow rate at the inlet and outlet are equal. Users only have to measure the flow rate at one side of the cooling channel, which is “mirrored” to obtain the flow rate at the other side of the channel. Thus, using the flow rate as the boundary condition is easier to control.
In terms of pressure, the inlet pressure is higher than the outlet pressure, and the flow is caused by this pressure difference. In Moldex3D, the default value of the outlet pressure is zero. Users only have to set the pressure boundary at the inlet, and this value will be equal to the pressure difference between the inlet and outlet. If we create a plot to show the relationship between the cooling-channel flow rate and pressure, we can see that as the flow rate gets larger, the pressure difference also grows larger. The two parameters are approximately proportional (see Fig. 1).
Apart from the pressure difference, flow resistance is another factor that will affect flow. Flow resistance varies with some conditions, such as cooling-channel diameters, channel length, channel-wall smoothness, coolant properties, and flow rate. The Darcy-Weisbach equation shows the relations between these parameters:
Δp = f × l/D × ρV2/2
Δp: Pressure Drop
f: Friction Factor
l: Channel Length
D: Channel Diam.
ρ: Density
V: Flow Rate
The function of a TCU is to push the coolant to flow and stabilize the coolant temperature. The main function of the pump in the TCU is to push the coolant to flow. When pump pressure rises, the flow rate decreases; when the flow rate increases, the pump pressure decreases. We can see the maximum flow-rate and pressure values on the TCU specification, but we have to note that the two conditions never exist simultaneously. We can see the TCU pressure is inversely proportional to the flow in Fig. 2.
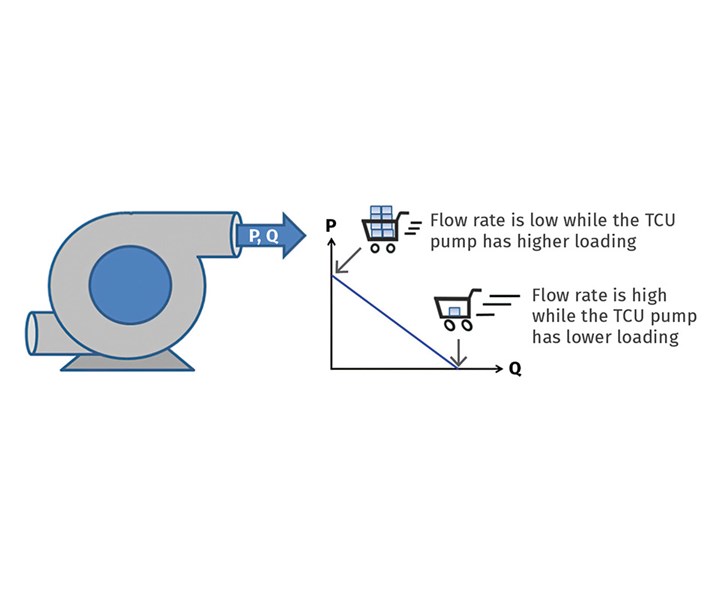
FIG 2 The inverse relationship between flow rate and pressure from the TCU pump.
Choosing a TCU with Molding Simulation
Users can obtain the flow rate and pressure difference of every cooling channel through Moldex3D’s cooling-channel analysis. The total flow rate of the cooling channels is the flow the TCU has to provide. The maximum pressure in the cooling channel is the minimum pressure the TCU must provide. Users can enter point coordinates of the total flow rate and maximum pressure differences in the line graph in Fig. 3. If the coordinate point is below the line, it means the TCU is able to provide enough flow rate and pressure. If the coordinate point is above the line, it means the TCU is not able to provide enough flow rate and pressure. The latest version of Moldex3D, R17, is now able to provide the data on maximum pressure drop, total flow rate, and heat dissipation. Users can evaluate the TCU’s performance by adopting the pump performance curve.
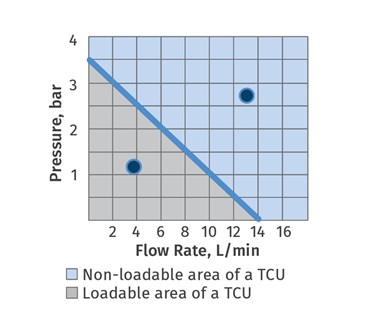
FIG 3 The loadable area of the TCU, as determined by the simulation of the total flow and pressure requirements of all cooling channels.
Things to Know before Running a Simulation
In the injection molding simulation, users usually set high flow rate as the ideal cooling-channel condition. However, users will get a large value after converting it to meet the requirements of the TCUs in the plant. Therefore, in order to shorten the gap between simulation and reality, it is better to set the channel boundary conditions based on the actual specifications of the TCU on hand. In addition to flow pressure, it is also necessary to take the cooling and heating capabilities of the TCU into consideration in simulation. Users can check the heating load of the cooling channels and compare the values with the TCU’s cooling and heating capabilities.
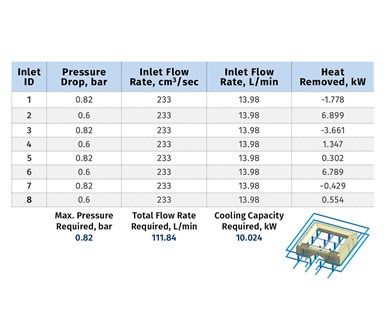
FIG 4 Output of required cooling-channel pressure, flow rate, and cooling capability, as determined by simulation.
If the cooling capability of the TCU exceeds the predicted heating load of the cooling channel, or its heating capability exceeds the negative heating load of the cooling channel, that means the TCU meets the requirement. Moldex3D also can export these crucial data gained from the cooling analysis as a .csv format. (Fig. 4). Simulation technology can provide critical data to help evaluate TCUs in your plant.
About the Author Yan-Chen (Thomas) Chiu is sr. architecture manager at the Product R&D Div. of CoreTech System in Taiwan, developer of Moldex3D molding simulation software. As a software engineer at CoreTech, Chiu has been devoted to the development of numerical methods for injection molding applications, especially in the heat-transfer field. Contact: sales.us@moldex3d.com; moldex3d.com.


Related Content

Tunnel Gates for Mold Designers, Part 1
Of all the gate types, tunnel gates are the most misunderstood. Here’s what you need to know to choose the best design for your application.
Read More
How to Select the Right Tool Steel for Mold Cavities
With cavity steel or alloy selection there are many variables that can dictate the best option.
Read More
Best Methods of Molding Undercuts
Producing plastics parts with undercuts presents distinct challenges for molders.
Read More
Why Shoulder Bolts Are Too Important to Ignore (Part 2)
Follow these tips and tricks for a better design.
Read MoreRead Next

Lead the Conversation, Change the Conversation
Coverage of single-use plastics can be both misleading and demoralizing. Here are 10 tips for changing the perception of the plastics industry at your company and in your community.
Read More
Recycling Partners Collaborate to Eliminate Production Scrap Waste at NPE2024
A collaboration between show organizer PLASTICS, recycler CPR and size reduction experts WEIMA and Conair will seek to recover and recycle 100% of the parts produced at the show.
Read More