
How to Use Kinetic Modeling Analysis To Predict Profile Part Failure
Real-world project demonstrates how kinetic modeling can help estimate the shelf life of parts.
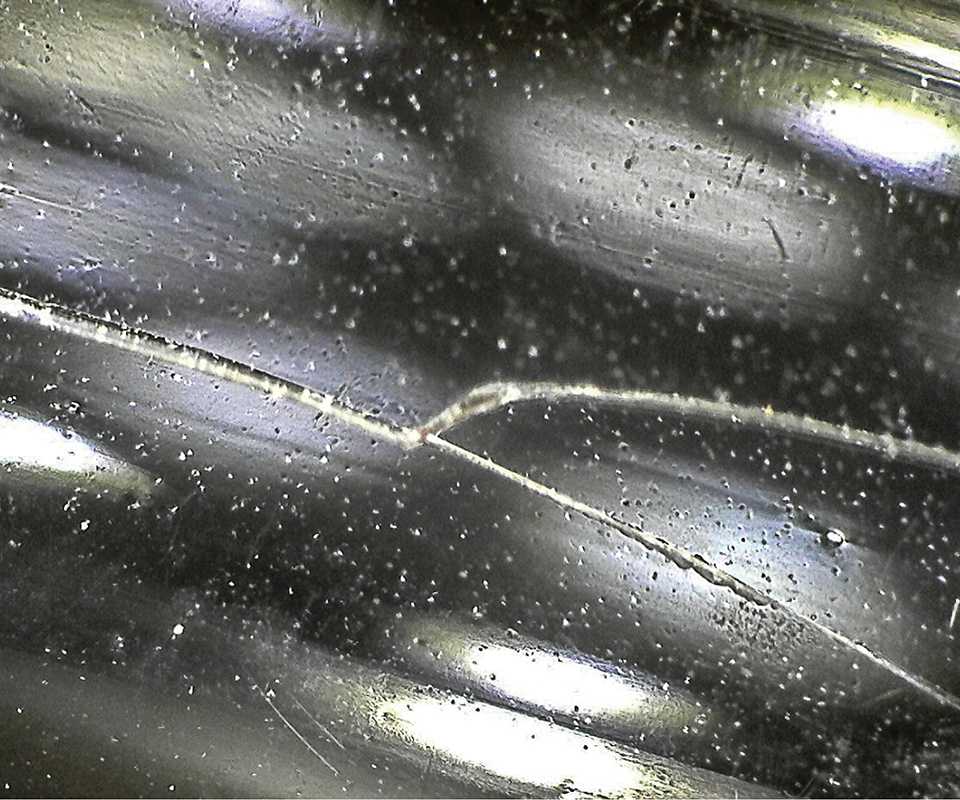
Teel Analytical Laboratories was tasked by a medical OEM to investigate why this profile (at 50x magnification ) cracked. The cause was suspected to be related to the loss of the plasticizer through evaporation over time. By using kinetic modeling analysis, Teel confirmed the evaporation and also determined how quickly it was occurring so that a shelf life for the product could be estimated.
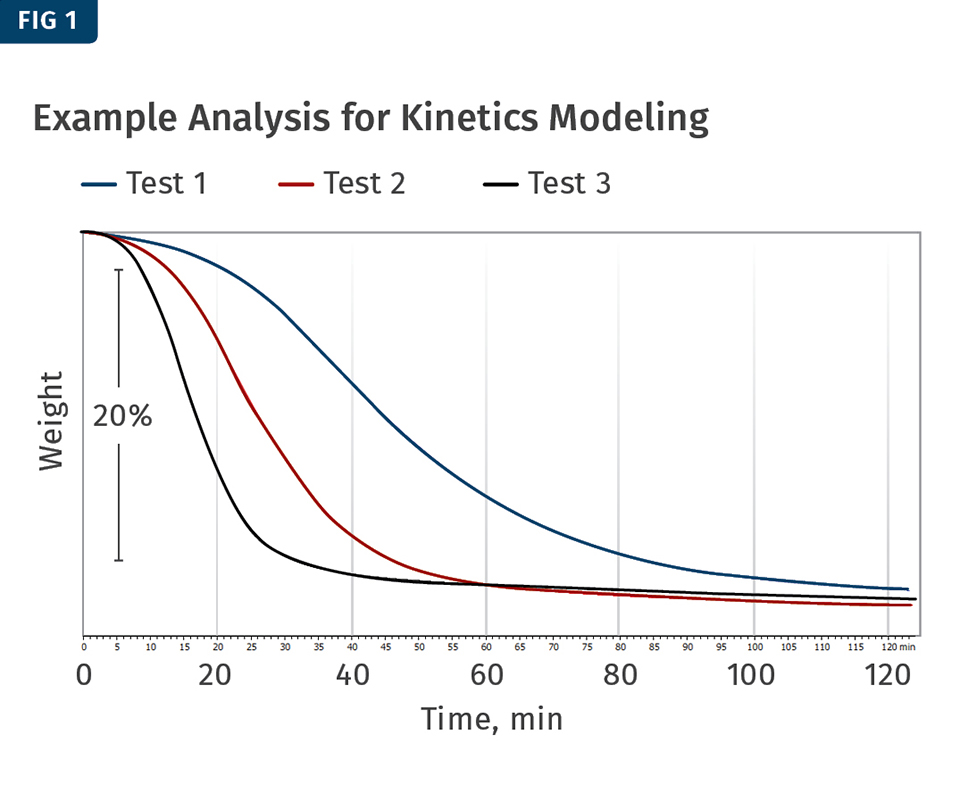
The kinetic model can predict how much time it will take for blowing agents to fully react at different temperatures. This ability comes from testing at least three points. The results from these tests show varying rates in which the chemical blowing agent reacts. The varying slopes of the curve signify the difference in the rate of weight loss.
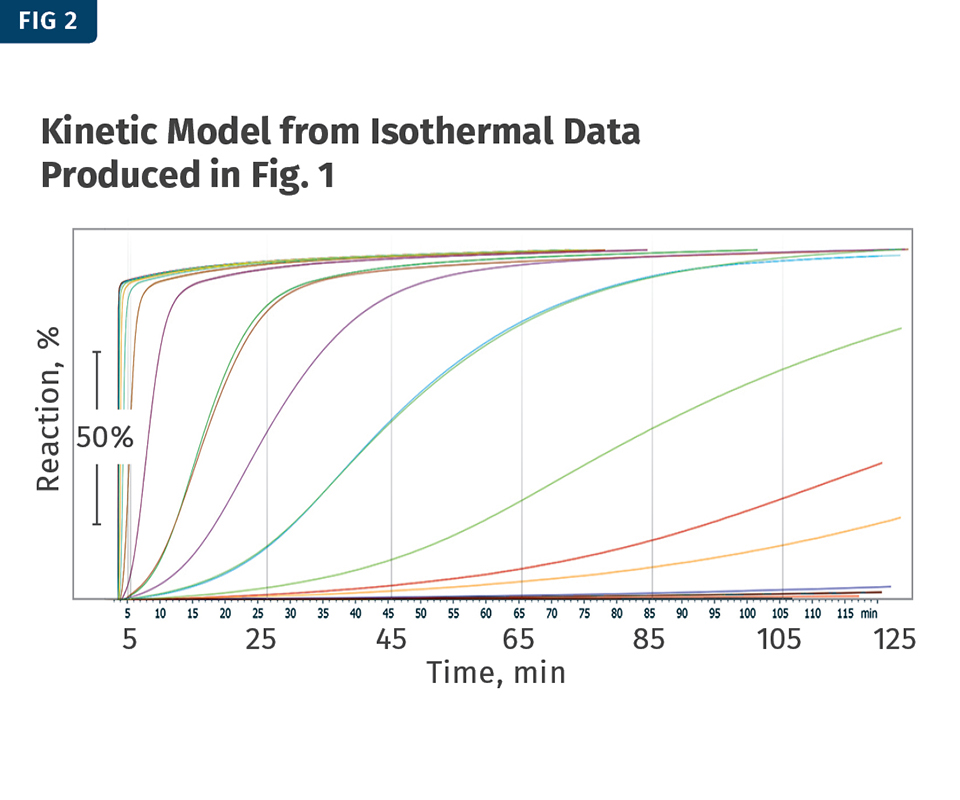
In this kinetic model from the isothermal data produced in Fig. 1, the temperature range (first row) spans from 150 C to 250 C. The percentages in the left column represent the completion of the reaction. It is important to note that the smallest final weight loss in Fig. 1 represents 100% reacted. Ideally, your weight losses are all similar so there isn’t any bias when creating the kinetic model.
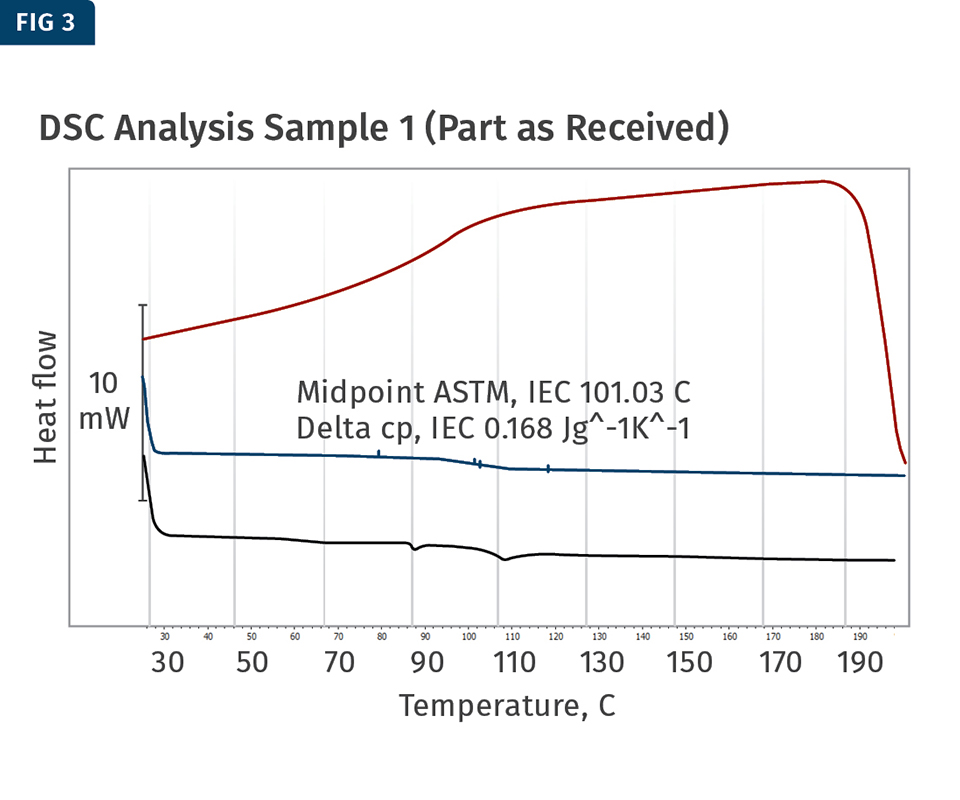
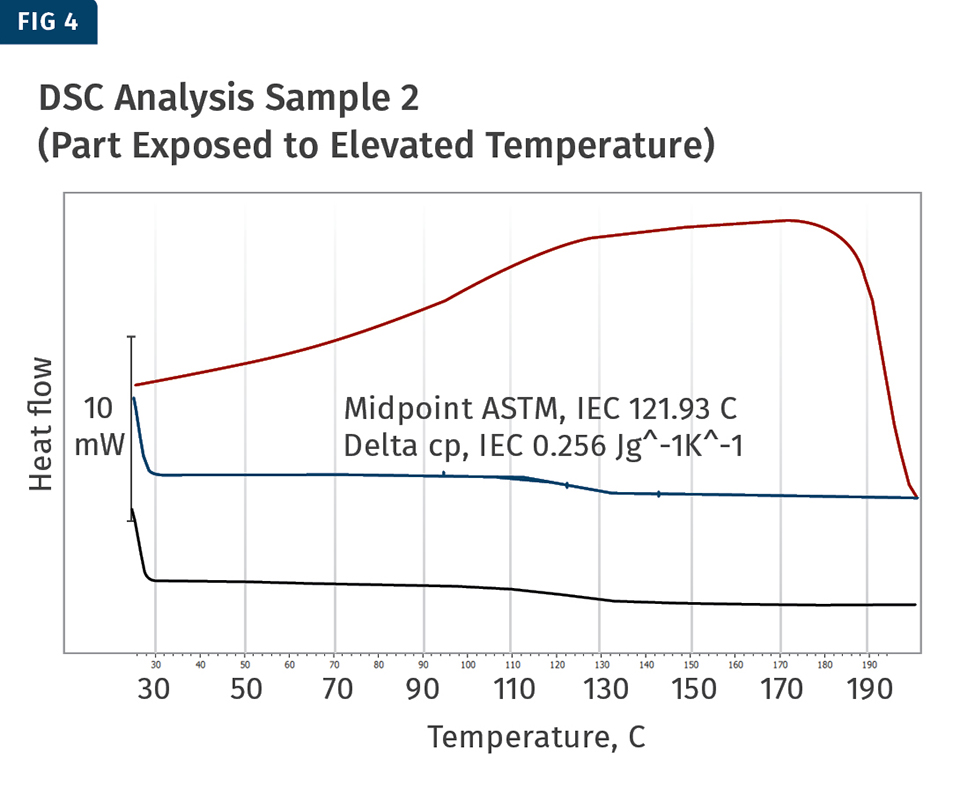
As the part was received, the glass-transition midpoint was found to be 101 C (Fig. 3) while the part that was exposed to elevated temperature experienced a large shift in the glass transition up to 122 C (Fig. 4). This shift was the evidence needed to support the theory that the plasticizer was evaporating out of the product post-production and was the likely cause of cracking.
As the part was received, the glass-transition midpoint was found to be 101 C (Fig. 3) while the part that was exposed to elevated temperature experienced a large shift in the glass transition up to 122 C (Fig. 4). This shift was the evidence needed to support the theory that the plasticizer was evaporating out of the product post-production and was the likely cause of cracking.
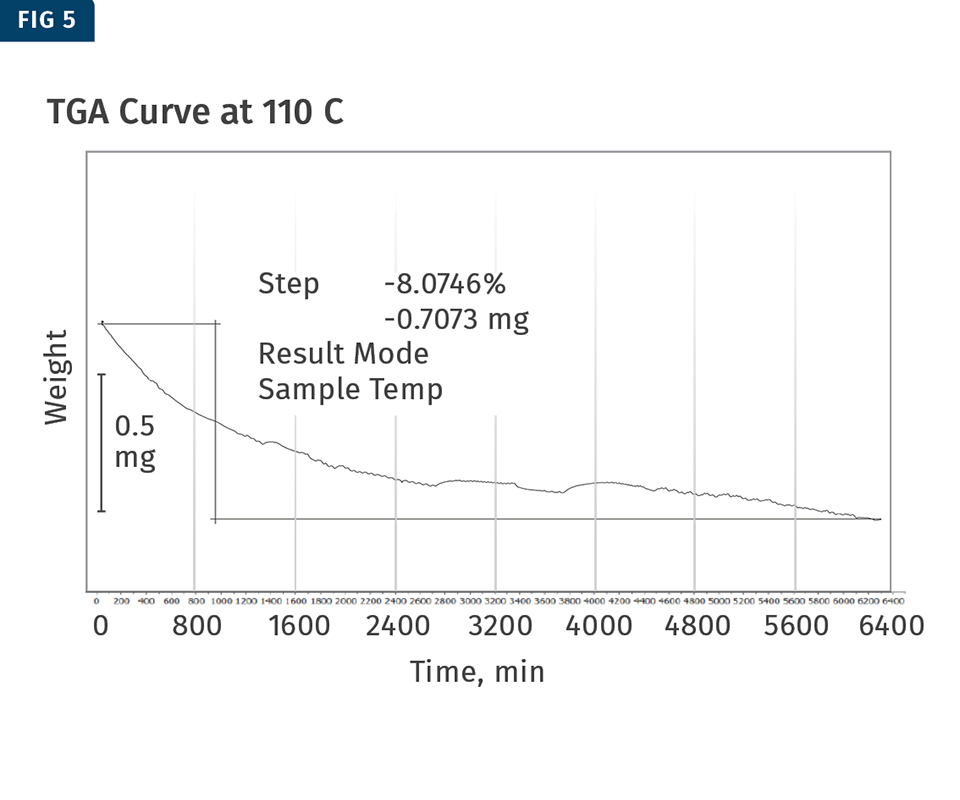
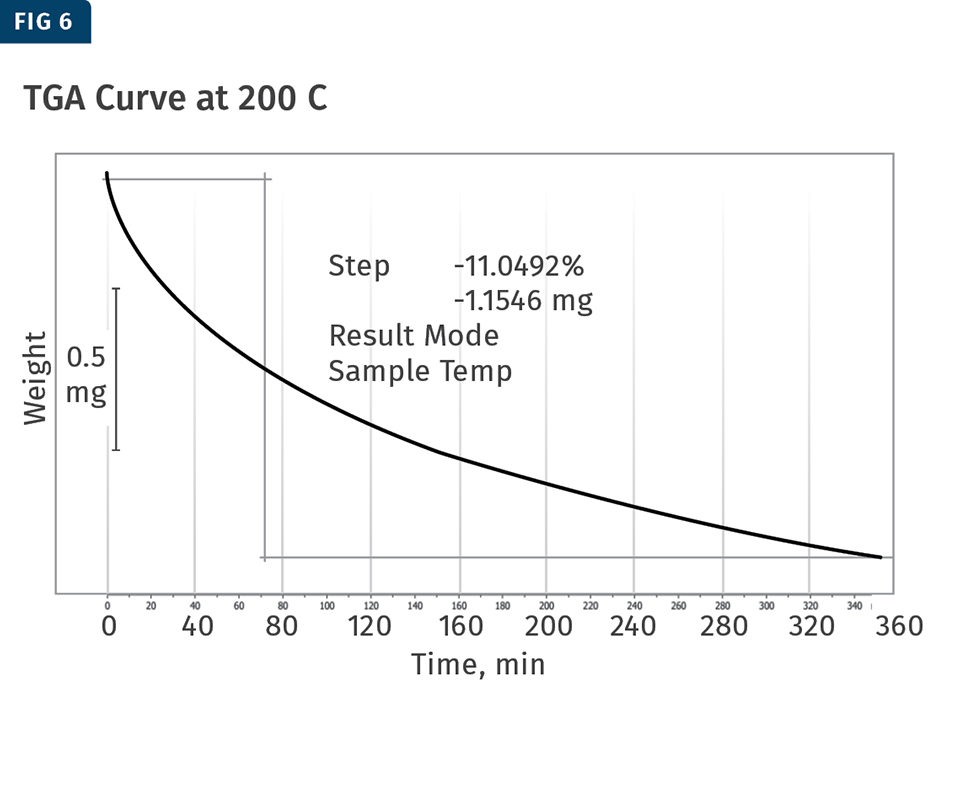
Each of the temperatures used to analyze the material was run for about 4.5 days using a TGA, held isothermally at that temperature. The total weight loss was then calculated for each test and the thermograms produced were used to create the kinetic model for the plasticizer weight loss. The 110 C and 200 C TGA curves are shown above.
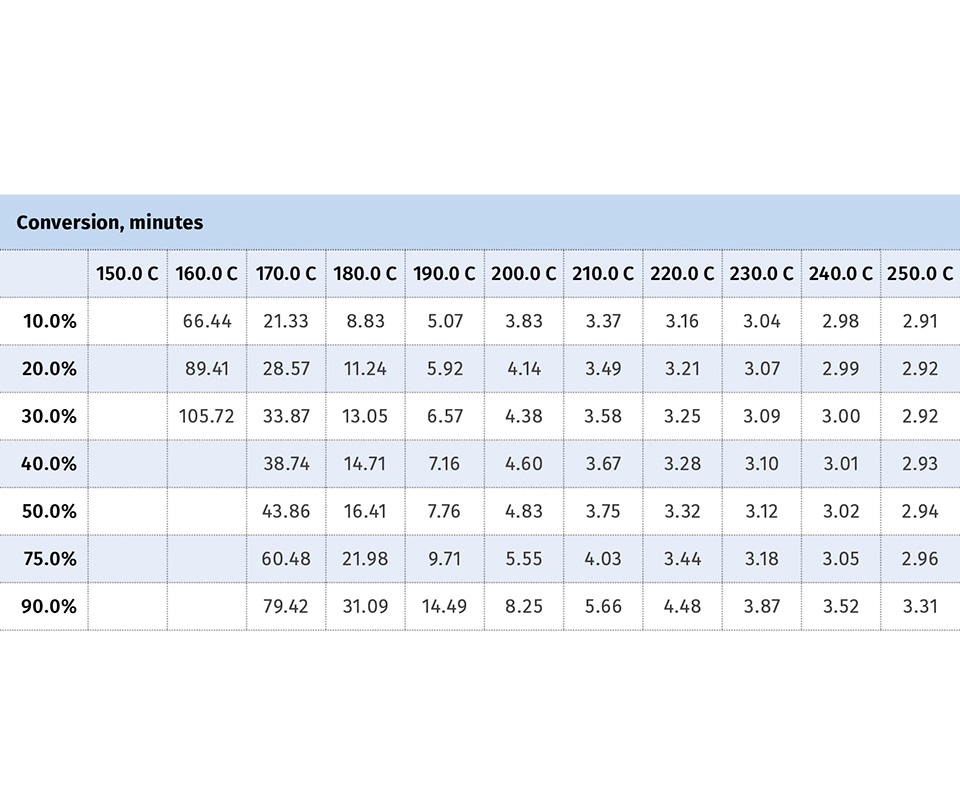
Combining the four curves produced by the TGA generated the kinetic model shown here. The table represents the kinetic model of the plasticizer lost through evaporation. The column on the left shows the percent loss of plasticizer from 10% to 99.5%, the top row shows the temperatures of interest and the body of the table is filled with time in hours.


In late 2014, Teel Analytical Laboratories, Baraboo, Wis., was approached by Connexicon Medical, a medical OEM based in Ireland, to investigate why a particular profile part was cracking. It was suspected that the cracking was related to the loss of the plasticizer through evaporation over time.
The goal of the project was to confirm the evaporation and also determine how quickly it was occurring so that a shelf life for the product could be estimated. Teel Analytical Labs had recently acquired a software program for thermal analysis, which allowed it to predict the kinetic models of reactions or events that took place in its products. A kinetic model produced by Differential Scanning Calorimetry (DSC) or Thermogravimetric Analysis (TGA) is used to estimate the impact that time and temperature (and possibly atmosphere) have on a particular reaction or event. For example, if a chemical blowing agent is used in an extruded part, the kinetic model can predict how much time it will take for it to fully react at different temperatures.
One of the more significant advantages of the kinetic modeling analysis is the ability to predict these reactions or events at times or temperatures outside of the testing parameters. This means that if testing was conducted over a span of a few minutes or hours, the model could estimate what would happen in days or even weeks. Similarly, if the temperatures tested only spanned a few degrees, the model would be able to estimate effects of a larger temperature range. This prediction ability comes from the testing requirement of at least three points. That is, at least three different tests, with varying parameters, need to be performed in order to obtain an accurate model. Using the example of the chemical blowing agent, a possible testing outline might look like this:
• Test 1: Ramp 150 to 180 C @ 10° C/min., Isothermal 180 C for 120 min.
• Test 2: Ramp 150 to 185 C @ 10° C/min., Isothermal 185 C for 120 min.
• Test3:Ramp150Cto190C@10°C/min., Isothermal 190 C for 120 min.
The results produced from these tests would show varying rates in which the chemical blowing agent reacts, allowing a model to be created. The different rates of the reaction can be seen in Fig. 1. The varying slopes of the curve signify the differences in the rate of weight loss. Since the weight loss in this case was an indication of the chemical blowing agent reaction, it was observed that the isothermal hold at 190 C produced the fastest reaction, followed by the isothermal hold at 185 C, and the slowest reaction at 180 C.
The kinetic model can be produced from this data, and although the time and temperatures were limited to up to 120 min and 180 to 190 C, the model can predict a much broader range of times and temperatures (see Fig. 2).
Figure 2 is the kinetic model from the isothermal data produced in Fig. 1. Note that the temperature range (first row) for this particular model spans from 150 C to 250 C. The percentages in the left column represent the completion of the reaction. It is important to note that the smallest weight loss at the far right of Fig. 1 is considered by the kinetic-modeling software to represent 100% reacted. This is how the software makes the calculation; ideally, your weight losses from each analysis are all similar so there isn’t any bias when creating the kinetic model.
That being noted, determining the tests to be conducted is critical to creating an accurate model. Interpreting the model table is as simple as matching a percentage with a temperature. For example, if you are interested in knowing how long it would take for 50% of the reaction to take place at 200 C, find where the row for 50% and the column for 200 C intersect. In this case, they intersect at a value of 4.83 min for 50% of the chemical blowing agent to react at 200 C with heat alone.
For chemical blowing agents, it is also important to note that other factors such as shear can impact the reaction rate, which is not taken into consideration in this model. So, in getting back to the original project request that Teel was presented with, the production and interpretation of this example model is similar to how the plasticizer evaporation rates were predicted.
PLASTICIZER EVAPORATION ANALYSIS
Since the cause of the cracking in the Connexicon Medical project seemed to have already been determined to be from plasticizer evaporation, initial tests were conducted to confirm that suspicion
DSC analysis was conducted on two profiles in order to provide that evidence. The first sample was a part tested as received, while the second was exposed to elevated temperatures to promote evaporation of the plasticizer. The results provided evidence that plasticizer was indeed evaporating (Figs. 3 and 4).
As the part was received, the glass-transition midpoint was found to be 101 C, while the part that was exposed to elevated temperature experienced a large shift in the glass transition up to 122 C. This shift was the evidence needed to support the theory that the plasticizer was evaporating out of the product post-production and was the likely cause of the cracking.
Initial testing was to be conducted on the sample at 50, 80, 110 and 140 C. But after the evaluation of the data, it was determined that a more expansive model could be created if the 50 and 80 C tests were dropped and 170 and 200 C tests were added. Making this change in the testing would improve the accuracy of the kinetic model and prevent any bias that may have come from the tests at 50 and 80 C. The need for this change was due to how the kinetic model equates the reaction percentages. Again, in weight-loss cases, the smallest loss will be used as 100% of the reaction. So, the closer that loss is to the true value in every test conducted, the more accurate the kinetic model. Tables 1 and 2 show two different sets of data.
In these examples, it was found that 0.0200 g of weight loss was 100%. However, in the results shown in Table 1, the tests run at 50 and 80 C fell short of that amount due to the length of time allotted at those temperatures. If these results were used to produce a kinetic model, 100% of the reaction would be attributed to the 0.0050 g weight loss at 50 C. This is obviously an issue, since it was determined after additional testing that the 0.0050 g loss is only 25% of the actual reaction. The results on Table 2 represent an ideal set of tests in which all the weight-loss results were similar, with the only differences in the test being the temperature and how quickly the reaction occurred.
Ideally, a portion of the testing to produce the kinetic model would be completed at a temperature comparable to real-world situations; but due to time constraints, the testing temperatures of 50 and 80 C were replaced with 170 and 200 C.
Each of the temperatures used to analyze the material was run for about 4.5 days using a TGA, held isothermally at that temperature. The total weight loss was then calculated for each test and the thermograms produced were used to create the kinetic model for the plasticizer weight loss. The 110 C and 200 C TGA curves are shown in in Figs. 5 and 6.
Combining the four curves produced by the TGA generated the kinetic model shown in Fig. 7. The table in Fig. 7 represents the kinetic model of the plasticizer lost through evaporation. The column on the left shows the percent loss of plasticizer from 10% to 99.5%, the top row shows the temperatures of interest, and the body of the table is filled with time in hours.
So if you wanted to estimate how long it would take for 50% of the plasticizer to be lost through evaporation at 30 C, we would simply determine where the 50% row and 30 C column intersect. In this case, the time would be roughly 2815 hr or around 117 days. Note that a few of the percentages under 4 C were left blank. This is due to the time setting applied to the model. In this model, a maximum time was set at two years. This means that in order for 50% of the plasticizer to evaporate at 4 C, it would take longer than two years. Upon completion of this project, a kinetic model was distributed to Connexicon Medical for the temperatures and times of interest so that the shelf life of the part was better understood.
ADDITIONAL KINETIC MODELING USES
This article has described one of many different uses for the kinetic-modeling software. Other projects for which Teel Analytical Laboratories has used this software include raw chemical foaming-agent reactions, compounded mixture reactions, and degradation kinetics. A few other common uses would be thermoset curing reactions, moisture or volatile loss kinetics, temperature-dependent reactions, and shelf-life determination. This software can be used for any reaction, curing, weight loss, or other thermal characteristic that can be measured on either a DSC or TGA.
ABOUT THE AUTHOR: Dan P. Clark is the laboratory supervisor for Teel Analytical Laboratories in Baraboo, Wis., a division of custom profile processor Teel Plastics. He graduated from the University of Wisconsin–La Crosse in 2007 with a degree in Biochemistry. He gained experience working in laboratories in the pharmaceutical, solar energy, and alternative fuel industries and has now been with Teel for three years. Contact: (608) 355-3080; dan.clark@teel.com; teel.com.


Related Content

The Importance of Barrel Heat and Melt Temperature
Barrel temperature may impact melting in the case of very small extruders running very slowly. Otherwise, melting is mainly the result of shear heating of the polymer.
Read More
Understanding Melting in Single-Screw Extruders
You can better visualize the melting process by “flipping” the observation point so that the barrel appears to be turning clockwise around a stationary screw.
Read More
How Much L/D Do You Really Need?
Just like selecting the extruder size and drive combination, the L/D should be carefully evaluated.
Read More
Specialty Purging Compounds Optimize Color and Material Changeovers
Selecting of the correct purging compound can speed up material and color changeover time and reduce scrap. You’ll even save on material.
Read MoreRead Next

Advanced Recycling: Beyond Pyrolysis
Consumer-product brand owners increasingly see advanced chemical recycling as a necessary complement to mechanical recycling if they are to meet ambitious goals for a circular economy in the next decade. Dozens of technology providers are developing new technologies to overcome the limitations of existing pyrolysis methods and to commercialize various alternative approaches to chemical recycling of plastics.
Read More
Understanding Melting in Single-Screw Extruders
You can better visualize the melting process by “flipping” the observation point so that the barrel appears to be turning clockwise around a stationary screw.
Read More