
Melt-Temperature Measurement Shows New Potential for Monitoring & Control
Unique melt-measurement system provides new types of data for quality and process control. A new version is coming soon.


As reported recently, efforts continue on a number of fronts to solve the long-standing “mystery” of melt-temperature measurement in injection molding (see July Close-Up). One of those pursuing this goal is Md Plastics, which has been continuously developing an injection process-monitoring and control system based on the unique Temp-Sense Melt Sensor. This bimetallic micro-bead sensor responds to both temperature and pressure, and thus measures the total thermal energy or “work” imparted to the melt during processing (see Oct.’15 Close-Up for details). For the sake of simplicity, the system software reports measurement results as temperature in degrees F or C, though it is in fact more complex than that. The results are said to be far more precise and consistent than previous methods of melt-temperature measurement—and they are taken in real time during injection, without any interruption of the process. Up to now, it has been difficult or impossible to obtain such real-time melt thermal measurement. Now, according to Michael Durina, president of Md Plastics, this new technology enables novel uses of melt thermal data for process analysis, troubleshooting, and control. “It will provide information molders have never been able to see before.”
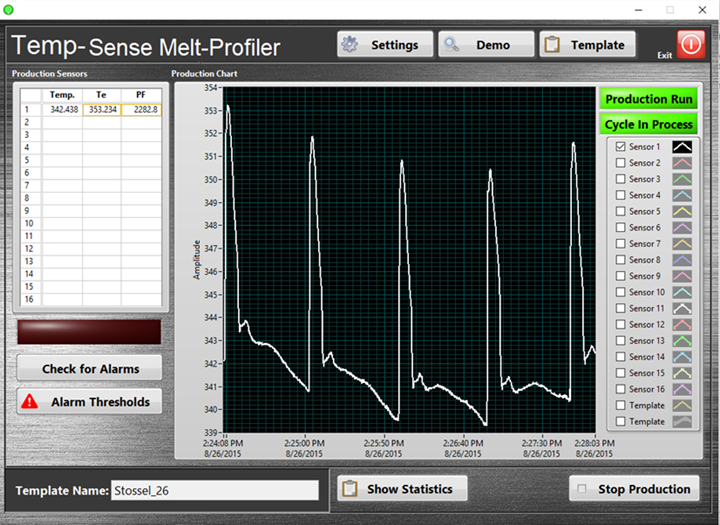
MD Plastics Temp-Sense Melt Profiler monitors can give users new insights into their molding process.
New System Coming Soon
The latest iteration of Durina’s melt-temperature technology is the Melt Profiler VII system. It consists of a small box of electronics—a data-acquisition device that accepts input from up to seven sensors. One of these is the Temp-Sense Melt Sensor, installed flush with the inner wall of the nozzle body or end cap. It can also take data from other temperature sensors in locations such as the water manifold, resin hopper and mold cavity. The unit comes with proprietary software that takes melt-temperature measurements 157 times/sec and calculates three key metrics used to predict part quality. These metrics are unique to the Melt Profiler system:


• Viscosity rise integral (Vr) is the area under the temperature (or melt thermal energy, “work”) curve from start of injection to the peak of the curve. This is said to correlate with the melt density. In the new system under development (see below), this will be changed to the integral under the entire filling curve, which Durina says will be more suited to process control.
• Max temperature (Te) is the maximum temperature measured during the cycle and usually occurs at max packing pressure.
• Power factor (Pf) is the area under the complete curve of fill, pack, hold and cool. This variable can be adjusted to capture more or less data to suit the shape of the thermal curve.
In the graphic output provided by the Melt Profiler system, the curve of the screw recovery portion of the process also can be used to identify issues such as screw and/or barrel wear, heater failures, lot-to-lot material variations, and check-valve slippage.
Currently, detailed display of process results requires a laptop to be plugged into the data-acquisition device. (A small handheld display is also available.) Durina says the next iteration of the Melt Profiler system, due to be released this fall, will have its own dedicated touchscreen display. It also will use a microprocessor with less than 1 millisec cycle time, allowing the system to calculate and display results faster than any current machine controller on the market, Durina claims. This will enable the Melt Profiler system to evolve beyond process monitoring to real-time control.
The new process control (shown in beta at K 2019) is called Melt-IQ. The user sets up the unit by performing a brief trial run of a part, so that the unit “learns” the shape of the curve as the “fingerprint” of a good part. The software uses the total fill integral (Pf) and the peak reading (Te) during injection to signal the transfer from fill to pack/hold. No screw position sensor is necessary, and the new system is not affected by variances in the closing of the nonreturn valve, since it measures only the thermodynamic output of the process. An alarm can be actuated if the peak and integral values vary outside of set limits, or if injection time exceeds a set limit.
Case Histories Reveal Potential
Three case histories illustrate how use of the Melt Profiler system can allow measurements of melt temperature or thermal energy to be used in new ways. Two of them involve TE Connectivity, a large Swiss-based, multinational producer of connectors, sensors, switches, relays, contactors and other electrical products. In one case, the company was molding a small electrical part in polyethersulfone. It used the Melt Profiler system to correlate degree of fill with Power factor (Pf):
• Good part: weight 1.110 g; Pf 453.06.
• Slight underfill: weight 1.105 g; Pf 402.75.
• Short shot: weight 1.090 g; Pf 251.72.
In this case, the machine had no way to sense the minuscule weight difference between a good and bad part. As shown here, minute differences in part weight are reflected in real time by noticeable differences in Pf. In this case, there is only a 0.005 g (0.4%) difference in weight between a good part and a near-full part, but there is a 50.31 (11.1%) difference in Pf. Based on the Melt Profiler data for this part, the molder set the alarm range for Pf between 436 and 465.
In a second case, TE Connectivity ran a test on part being molded of nylon 66 on a brand-new, high-tech injection press. Over a run of 100 cycles, the molder saw large differences in peak pressure to fill—standard deviation was about 415 psi, and the min/max difference was 2162 psi vs. an average of 12,225 psi—but the machine’s controls managed to achieve consistent part weight nonetheless. “You can see how hard the machine had to work,” says Durina, pointing to the swings in injection pressure and in packing pressure, which varied as much as 20% from the average.
Despite making good parts, the process variations were a matter of concern to the molder. Use of the Melt Profiler identified significant differences in temperature or heat content at injection start. There appeared to be a long-term cyclic pattern as well. The main thermal influence on the melt before injection is the screw’s plasticating of the melt. Durina says other Melt Profiler data—fill integral (Vr) and Te—indicate fluctuations in melt viscosity at the start of injection, which he attributes to inconsistent plasticating, one of the deficiencies he and others have long observed with so-called “general-purpose” screws. Although no definitive solution was reached in this case, the Melt Profiler system was able to predict that more or less pressure would be needed to fill the next shot based on the results of the last one.
A third example involves a PP consumer-goods part made at a large Midwest molder. The problem here was short shots, and the Melt Profiler revealed the answer. As shown in the graph on this page, the initial rise in melt temperature/heat content at the start of injection displays a “hiccup” before continuing its rise to Te. “That’s your nonreturn valve slipping before it fully closes,” Durina concludes. He adds that he has never seen a conventional machine-control display that identified the culprit so clearly.
Durina says there are around 30 Melt Profiler systems of various generations in the field, used primarily in medical and electronics molds. However, one molder of childrens’ car seats is archiving Melt Profiler data on every shot for product-liability protection.


Related Content

Know Your Options in Injection Machine Nozzles
Improvements in nozzle design in recent years overcome some of the limitations of previous filter, mixing, and shut-off nozzles.
Read More
How to Reduce Sinks in Injection Molding
Modifications to the common core pin can be a simple solution, but don’t expect all resins to behave the same. Gas assist is also worth a try.
Read More
Understanding the ‘Science’ of Color
And as with all sciences, there are fundamentals that must be considered to do color right. Here’s a helpful start.
Read More
How to Stop Flash
Flashing of a part can occur for several reasons—from variations in the process or material to tooling trouble.
Read MoreRead Next

Injection Molding: Making Melt Temperature A Useful Tool for Process Control
Portable, standalone data monitor replaces a laptop. Newest system uses melt thermal data to signal injection fill-to-pack switchover.
Read More
New Sensor Tech Monitors State of the Melt During Molding
Detect ‘true’ melt temperature, viscosity variations, melt density, and much more, throughout the molding cycle.
Read More
People 4.0 – How to Get Buy-In from Your Staff for Industry 4.0 Systems
Implementing a production monitoring system as the foundation of a ‘smart factory’ is about integrating people with new technology as much as it is about integrating machines and computers. Here are tips from a company that has gone through the process.
Read More