
How Characterizing and Modeling Chemical Foaming Agents Can Help Your Process
Knowing ahead of time what will happen when your CFA produces gas can help you design or improve your process to boost quality and cost effectiveness.
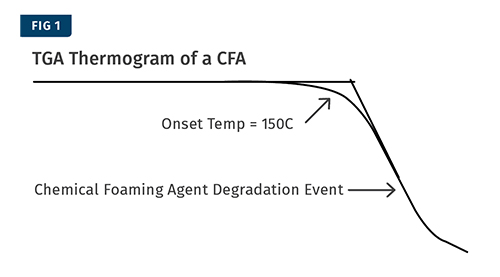
TGA thermogram tests identify the temperature at which the CFA activates so that the transitions in other tests can be positively identified as originating from the CFA.
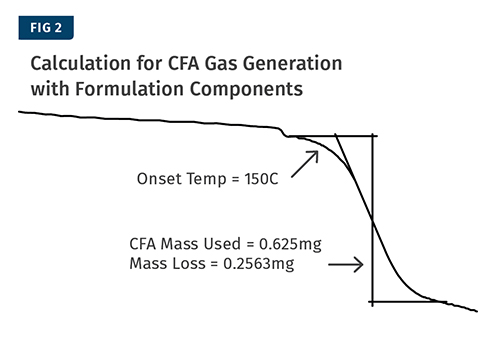
In a complete formulation, a sample contained 0.625 mg of CFA and the measured mass loss was 0.2563 mg. The resulting calculation is that the CFA lost 41% of its mass as gas.
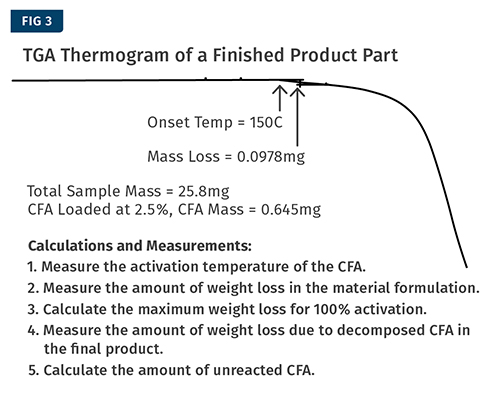
Calculations and Measurements: 1. Measure the activation temperature of the CFA. 2. Measure the amount of weight loss in the material formulation. 3. Calculate the maximum weight loss for 100% activation. 4. Measure the amount of weight loss due to decomposed CFA in the final product. 5. Calculate the amount of unreacted CFA.
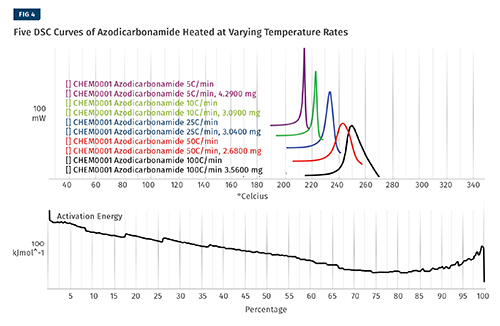
Five separate tests were conducted on a DSC with the CFA, heating it from room temperature well through its degradation point. An azo-based foaming agent, which has only a single decomposition step, was used. The five tests are identical except for the rate at which the temperature increases. The five tests are then cropped to exclude any data that isn’t associated with the degradation. At this point the software performed a series of complicated calculations using patented algorithms to determine the activation energy of the reaction as it progressed to completion. Those two items are shown here.
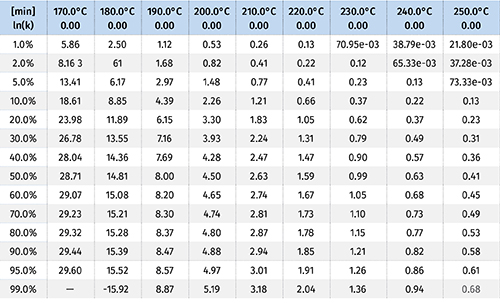
he output of the process shown in Fig. 4 is a kinetic model that can be used to make predictions for the rate of the reaction. The tables, which can be customized, are shown here.


Chemical Foaming Agents (CFAs) come in a variety of types. Some produce exothermic reactions, some produce endothermic reactions, some have a single component, while others are mixtures of many; and the temperatures at which they activate can vary.
Despite these variables, all CFAs have one thing in common: The molecule is designed to decompose at a specific temperature and to produce a gas as part of that decomposition. This process effectively turns your processing machinery into a “chemical reactor” where time and temperature can influence the activation of the CFA.


This article will show how different testing techniques can be used to characterize performance of a CFA and determine if there is any residual unreacted CFA in finished products. We will also explain a reaction modeling technique that provides information that can be applied to the design of a process.
Knowing how much CFA is reacting in your process can be important for a number of reasons, depending on individual circumstances:
• The CFA may be expensive and you would want to make sure you aren’t wasting the additive unnecessarily.
• Perhaps the end customer doesn’t want unreacted CFA leaching out of the product for regulatory reasons.
In order to determine how much of the CFA remains unreacted in the product, a thermogravimetric analyzer (TGA) is used. The first step is to take the CFA all by itself and analyze it in the TGA. This is usually done by heating approximately 10 mg of the material from around 50 C (120 F) up to well past the plastic resin’s processing temperature at a rate of 10° C (18° F)/min. Depending on the CFA, you may have a single gas-generation event or multiple events. For the purposes of this example, we’ll deal with CFAs that have a single degradation event.
An example of a typical TGA thermogram from this test is shown in Fig. 1. The purpose of this test is to identify the temperature at which the CFA activates so that the transitions in other tests can be positively identified as originating from the CFA.
The next step is to test the complete raw-material formulation to measure the amount of gas that the CFA releases. It’s important to test the CFA in the presence of the other materials because components of the formulation can change the amount of gas released by some CFAs. Ideally, the individual components should be measured directly into the test crucible and not premixed and transferred so that the exact mass of the CFA is known.
However, in some cases this may not be possible and you will have to make the assumption that your premixed/compounded material is homogenous. The same TGA test as before is performed and the sample is heated from around 50 C to well past your material processing temperature at a heating rate of 10° C/min.
The percent of CFA that turns into gas when combined with the formulation components can be determined using the calculations shown in Fig. 3. In this example the sample contained 0.625 mg of CFA and we measured a mass loss of 0.2563 mg. The resulting calculation is that the CFA lost 41% of its mass as gas. The measurement is shown in Fig. 2.
The final step is to measure a finished product to determine the amount of unreacted CFA (see Fig. 3). For this step it is important to take a representative sample of the part, as the amount of unreacted CFA may vary from location to location in a larger part or in a part that has a complex geometry. You may want to test multiple locations on the part and get results from different areas.
For this step it will be important to know the instrument’s limit of detection. The instrument used for the example measurements shown has a limit of detection of 38 µg. The calculations for this example are shown adjacent to Fig. 3. The measurements show that 37% of the CFA remained inactivated in the finished product.
MODELING THE CFA REACTION
The activation of CFAs is a chemical decomposition that produces gases as the products of the reaction. The CFA needed to foam your part needs some combination of time and temperature to react completely prior to depressurization and foaming. Kinetics is the term used to describe the reaction rates. By creating kinetic models of the CFA reaction, limits on the production process can be calculated. It is important to understand how choices of CFA can affect limitations to processing temperatures, line speeds, or cycle times.
To create the kinetic model, a series of measurements are made using either a differential scanning calorimeter (DSC) or a TGA. For this example we will be showing data created from a DSC. Five separate tests were conducted with the CFA, heating it from room temperature well through its degradation point. Some CFAs have more than one degradation event; if this is the case, each event should be modeled separately.
For this article we will use azodicarbonamide (azo), which has only a single decomposition step. The five tests shown in Fig. 4 are identical except for the rate at which the temperature increases. The five tests are cropped to exclude any data that isn’t associated with the degradation. At this point the software is used to perform a series of very complicated calculations using algorithms that are protected by patents to determine the activation energy of the reaction as it progresses to completion.
These items are shown in Fig. 4. The output of this process is a kinetic model that can then be used to make predictions for the rate of the reaction. The tables, which can be customized, are shown in Fig. 5.
Now that we have the kinetic model of the CFA reaction, we can apply the information to real-world processes. The model makes the assumption that the temperature is constant, and we know that isn’t true in real-world situations, but we can use a reasonable temperature estimate that still gives us valuable information.
SITUATION 1: REACTING FROM SHEAR ALONE
Let’s take a hypothetical example and assume that a processor is extruding polyethylene. The processor measures the melt temperature across all of the zones, and while they vary slightly overall, the average temperature is about 180 C (355 F) and the residence time of the material in the barrel is about 4 min. In looking at the kinetic model we can find the column for 180 C and move down until we hit a value of 4 min.
In the example from Fig. 5, that value is between 2% and 5%. This means that the processor can expect 2-5% of the azo to activate from the temperature of the polymer melt.
Now the processor would immediately notice that it is getting a lot more than 5% activation and that these numbers don’t make sense. What these numbers tell you are that the melt temperature isn’t activating your CFA—shear is, and there’s a good chance it isn’t activating all of it. A number of important conclusions can be made from this information:
1. The CFA is primarily reacting through shear.
2. You likely have some CFA left over that isn’t being activated.
3. Anything that impacts shear will impact the amount of CFA activation, such as:
• Changes in lubricant packages in the resin,
• Lot-to-lot variation in lubricants or colorants,
• Screw wear over time.
• Different screws.
This situation is not ideal because controlling the amount of gas generation is more difficult than necessary. Ideally 100% of the CFA would activate from the processing temperatures alone to ensure a consistent production of gas within the process. When shear is the primary driver of CFA activation, it introduces additional variables that need to be controlled to produce consistent product quality.
SITUATION 2: LIMITS ON LINE SPEED
Let’s take a second hypothetical example and assume that an extrusion processor is running polypropylene at an average melt temperature of 210 C (392 F), has a material residence time in the barrel of about 4 min, and is operating at a rate of 100 lb/hr. This engineer wants 100% activation of the CFA from temperature alone, and doesn’t want to rely on shear effects to activate it. Based on the information from the kinetic model, this engineer is in good shape. It is predicted that 99% of the CFA will activate at those temperatures in just a little over 3 min.
But then the production manager comes to the engineer and wants to double the line speed to 200 lb/hr, which would cut the overall residence time of the material in the barrel to 1.5 min. Using Fig. 5, we’d be able to predict that the CFA activation would go down. It will achieve a little less than 20% activation on temperature alone, and then you’ll be in the same situation that was discussed in the first example—fighting shear effects. The alternative is to use the model to guide process changes to maintain 100% activation from melt temperatures. In this example, the engineer would want to increase the temperatures to an average of about 230 C (446 F).
The model allows the engineer to visualize and estimate limits on the process. There is an upper and lower limit to the line speed at a particular processing temperature, because you need the CFA to activate within a particular zone to be effective. If it activates too early and the melt isn’t pressurized enough, the gas will escape; and if it isn’t given enough time it won’t activate completely and you’ll be wasting the CFA.
SITUATION 3: LIMITS ON PROCESSING TEMPERATURES
The kinetic model allows for the identification of temperature limits as well. Given a particular line speed and material residence time, an engineer will need to make sure that the CFA is activating in the correct screw/barrel zone where there is sufficient pressure to keep the gases produced from escaping. Let’s say a process was designed so that the material was conveyed and melted at an average of 220 C (428 F) over the course of 1.5 min. Then, after this zone the material is pressurized for the CFA to react and produce the gas. The kinetic model produced would tell you that you are likely losing 50% of the gas being generated because you’re activating it too early, before it’s pressurized. That’s money being wasted because the reaction kinetics aren’t understood.
In this example the model would tell us we should lower the temperature below 190 C (374 F) in order to prevent more than 1% of the CFA from being activated too early.
The application of these testing processes and techniques allows for the characterization of CFAs and the estimation of processing limits that will be applied to a particular process design. Knowing how the reaction progresses ahead of time will allow for intelligent design of a production process to avoid needless waste of the CFA while ensuring a consistent activation, which helps improve process quality.
The techniques can also save valuable time and money in trial-and-error development work by providing information to engineers up front before equipment and processes are chosen.


Related Content

Macro Names Anzini Tech Sales Manages for Southeast
Has worked in technical roles for leading processing companies in his career of 40+ years.
Read More
Davis-Standard to be Systems Integrator for Novel EDI Flat Die
Die uses motorized lip-adjustment, said to be three to five times faster than heated-bolt adjustments.
Read More
How to Effectively Reduce Costs with Smart Auxiliaries Technology
As drying, blending and conveying technologies grow more sophisticated, they offer processors great opportunities to reduce cost through better energy efficiency, smaller equipment footprints, reduced scrap and quicker changeovers. Increased throughput and better utilization of primary processing equipment and manpower are the results.
Read More
Green’s the Theme in Extrusion/Compounding
The drive toward circular economy is requiring processors to make more use of PCR. Machine builders at K—across all extrusion processes—will be highlighting innovations to help them do just that.
Read MoreRead Next

Teel Plastics: Where Science, Tech, Quality and Innovation Meet
This family-owned custom profile and tubing business controls its own destiny by controlling, well, everything.
Read More
A Processor’s Advice on How to Get Moisture Testing Right
Follow these four steps to ensure your results are on target.
Read More
Lab Investment Pays Off For Major Tube & Profile House
Teel started a testing laboratory in 2010 to support quality assurance and new product development and to troubleshoot manufacturing issues as they arise.
Read More