
How Production Monitoring Can Make You a Better Processor
Real-time information on all your production equipment not only boosts productivity and profitability, but it encourages proactive vs. reactive thinking and sharing of best practices. See how this approach benefited a blow molder with 19 plants.


Guidewheel allows use of mobile devices to view production data, receive alerts, and enter downtime reasons into the cloud database. (Photos: Guidewheel)
Has something like this ever happened in your plant? The head of operations gets a call that a certain machine is down, and of course it has to be a machine that is responsible for a tenth of the revenue for the entire plant. Fortunately, the operations head knows that machine well and he fires off some instructions on what to check first to get it back up and running.
But his blood pressure hits the ceiling when he learns that the machine had been down for 24 hours before he got the call. It started with the operator on the plant floor, who was responsible for several machines and didn’t notice that this one had halted. Then the shift changed over before the stoppage could be addressed. Next, the plant manager tried to find a maintenance technician familiar with that machine. He and the busy technician played phone tag for a while. Thus, what should have been a 30-minute fix ended up taking 24 hr.


As horror stories go, this one is not so far-fetched, according to Lauren Dunford, CEO of Guidewheel, a new company offering machine-monitoring systems. She says, “Most manufacturers lose up to 20% of available production time to stoppages both planned and unplanned. And human error causes 23% of unplanned downtime. Reactive “firefighting” results in losing more than 33 days of production time per year in typical plants. All of this eats up as much as 20% of potential revenue.”
Identifying and addressing the ‘low-hanging fruit’ of unnecessary downtime can have high impact on plant productivity and revenue.
The cautionary tale above was recounted by Dunford during a recent Plastics Technology webinar on her company’s FactoryOps monitoring system. The moral of the story, she says, is the cost of not knowing what’s going on with your machines in real time: “It’s not just daily pain and frustration, it’s huge amounts of money left on the table.”
Dunford notes that much of the downtime experienced by manufacturers of all kinds is due to human factors—inefficiency in changeovers and setups due to correctable errors like not having material or equipment ready when they’re needed. The good news is that ameliorating these human factors is a key side benefit of implementing a real-time machine-monitoring system.
Visibility of OEE data for different plants is useful to corporate managers and also can spur “friendly competition” between plants.
A ’Universal’ Monitoring Solution
As reported in a December ’21 Close-Up, Guidewheel’s FactoryOps system is a simple, affordable approach that’s said to be quick and easy to implement—in a matter of hours with remote support and training, not requiring an on-site visit. It uses a proven technology in a new way: Clip an amperage meter around the power cord to any machine of any type—primary or auxiliary, new or old—and the data is sent to the cloud, where FactoryOps software monitors the “heartbeat” of the machine. With the aid of artificial intelligence to “learn” the normal pulse of different machines, electrical current monitoring “makes crystal clear any micro-stops or longer downtime,” says Dunford, and also can indicate when a non-cyclical machine like an extruder is running slower than usual, or when a change in amperage indicates a need for maintenance before a potential breakdown occurs. It’s an “always-on source of truth,” as Dunford describes it.
If the FactoryOps system detects a stoppage or other anomaly, it can send text or email messages to specified personnel for a particular machine, and if the alarm is not addressed in a specified time, messages can be sent to additional people.
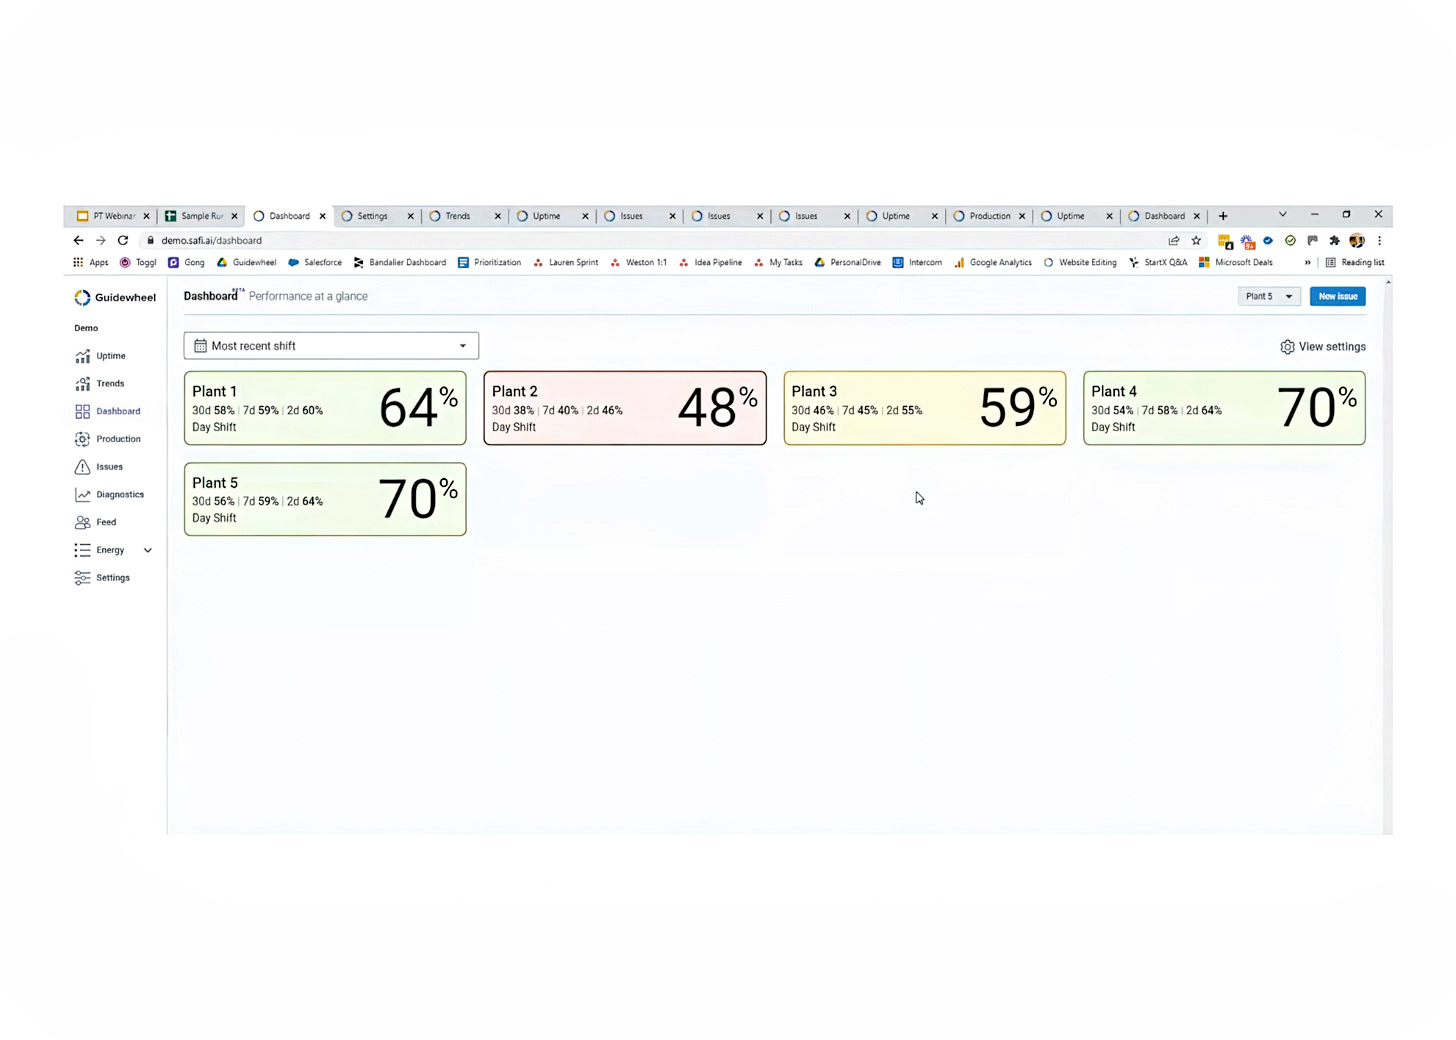
Real-time data and alerts on uptime and downtime and cycle time are described by Dunford as “low-hanging fruit” that can have high impact on plant productivity. This data can be supplemented by operator input of downtime and reject codes and other machine-derived data, such as voltage, to populate a customized dashboard that displays OEE (overall equipment effectiveness) by machine, plant, and time period, as well as energy consumption in kWh/lb. Reports customized for different people can convey machine uptime/downtime, trends, and most common issues. Reports can be configured by shift, day, week, or other period. With such data at everyone’s fingertips, Dunford says one multi-plant manufacturer reduced a weekly joint phone meeting between headquarters and the various plant managers from up to 2 hr of paging through spreadsheets to no more than 45 min (see Fig. 1).
Dashboard view of four machines in one plant shows, for example, that one technician accomplished a blow molding changeover in much less time than another technician and may therefore have valuable knowledge or skills to share with the slower technician.
How Sharing Data Improves Operations
Besides grabbing those high-impact “low-hanging fruit,” Dunford says real-time machine monitoring can increase shop-floor employee engagement in plant productivity goals. A number of FactoryOps users display OEE data from the online dashboard on a screen in an employee break room or on the shop floor, where it can stimulate “friendly competition,” Dunford says, between operators on different production lines or between plants within the company.
Visibility of production data encourages sharing of best practices within a plant and between plants.
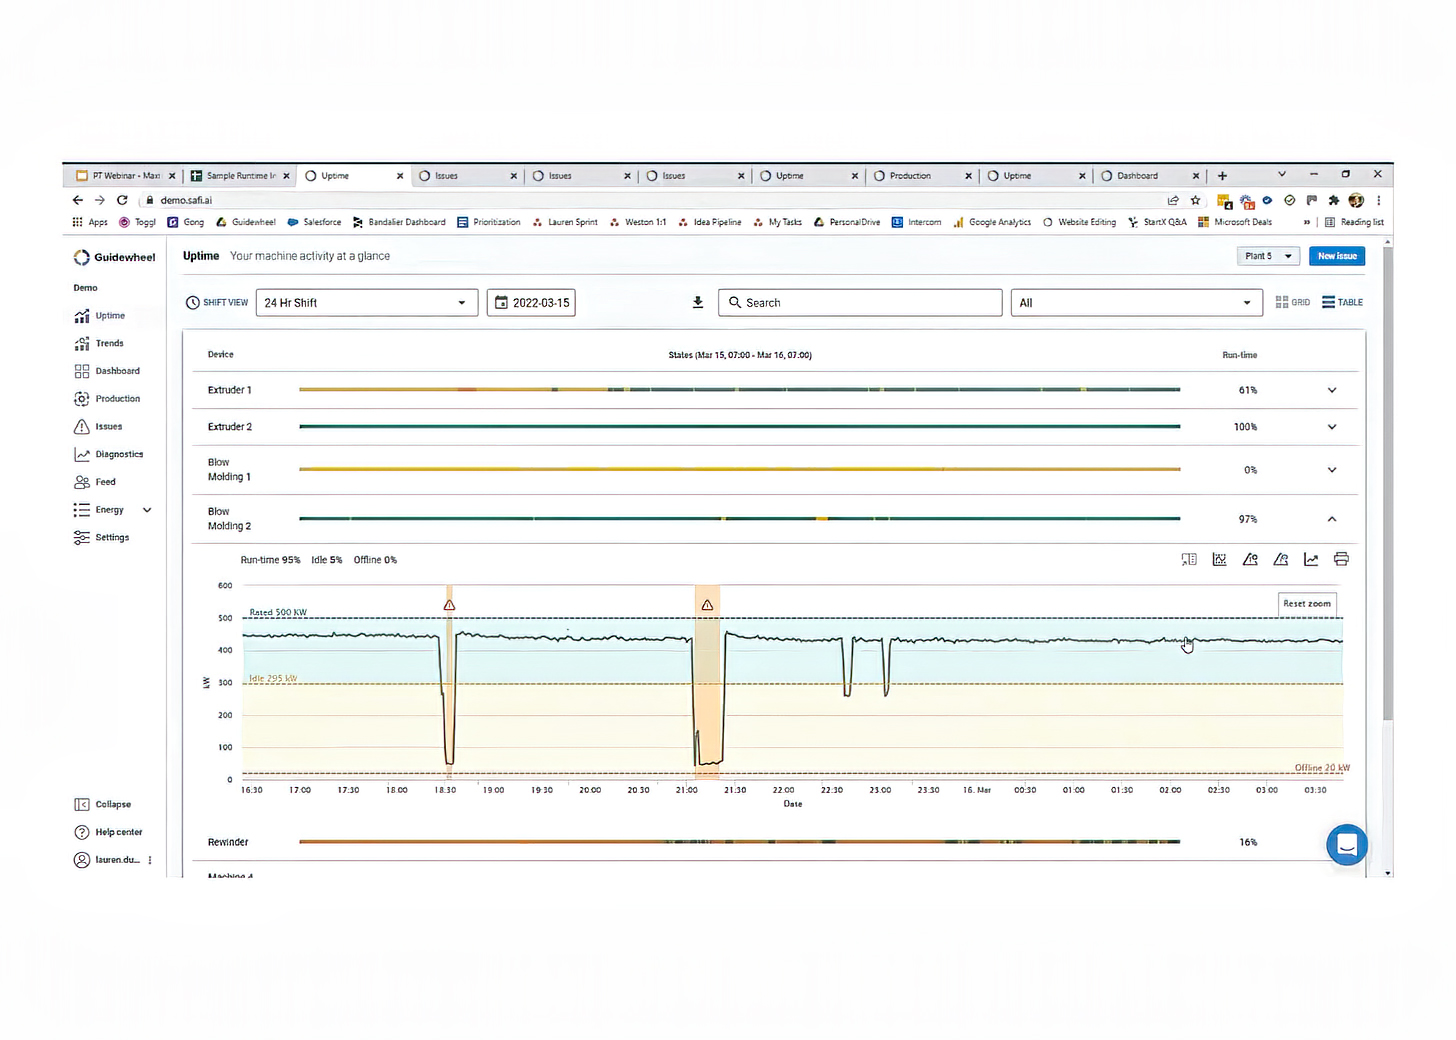
Even more useful is the opportunity to use machine data to identify and share best practices between plant personnel. For example, Fig. 2 shows a screenshot of a plant with two extruders and two blow molders being monitored. Details on an 11-hr stretch of production on Blow Molding machine 1 is magnified to highlight two downtime events for changeovers. Notice that the first changeover is much shorter than the second one—and apparently more effective, too, since the second changeover was followed by two micro-stops to make further adjustments. Perhaps the technician involved in the first changeover could share some tips with the second technician—preparing certain tools or equipment in advance, perhaps, and ensuring that new material is available at the machine when the changeover is finished.
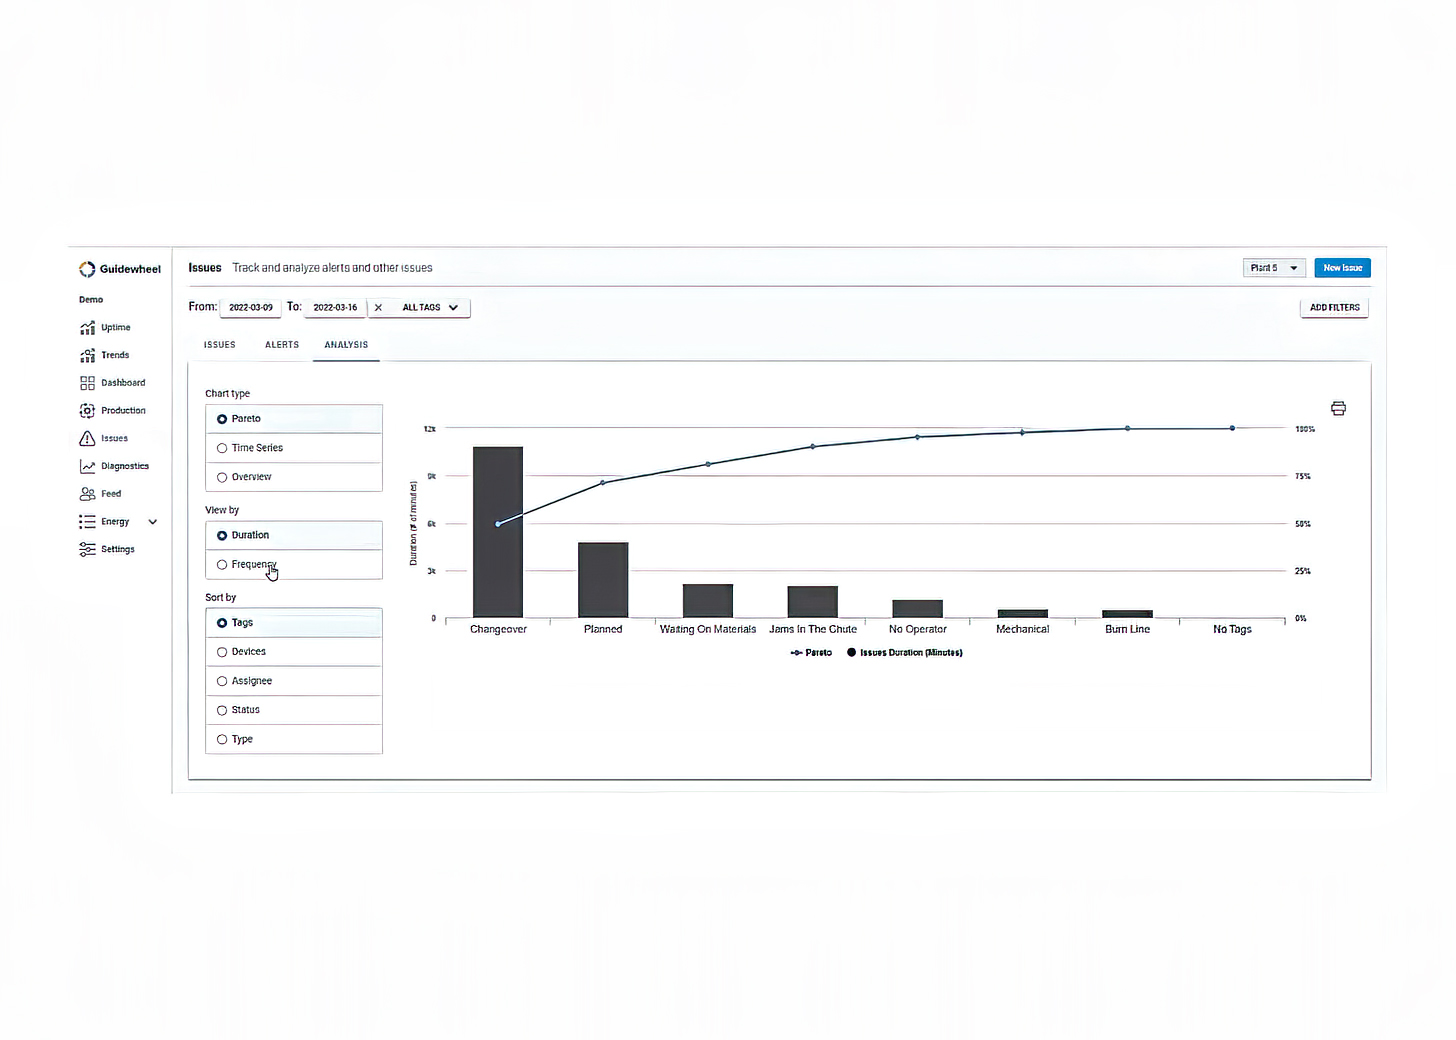
Pareto charts clarify visually how to prioritize attention to issues that are causing the most downtime and lost productivity.
Use of Pareto charts (Fig. 3) can help plant personnel prioritize maintenance, training or other activities to address the problems that are costing the most in downtime and lost revenue. One Guidewheel customer used such a chart to highlight burn lines in extruded products as a major issue. Drilling down further into the FactoryOps data revealed that burn lines were not a plantwide problem, but were restricted to one extruder in particular. Pulling and cleaning the screw enabled the customer to fix the problem.
Dunford adds that FactoryOps data encourage users to ask other questions in the search for continuous improvement. Such as, “Where might we have issues that we don’t even know about yet?” She cites the example of a plant with an extruder that scored 100% uptime shift after shift, day after day—for too many days, in fact. Looking back on the archived data showed why that extruder looked “too perfect”—it was not receiving regular cleaning. By the time managers decided it was high time to take a closer look at that machine, it had just started producing off-spec product.
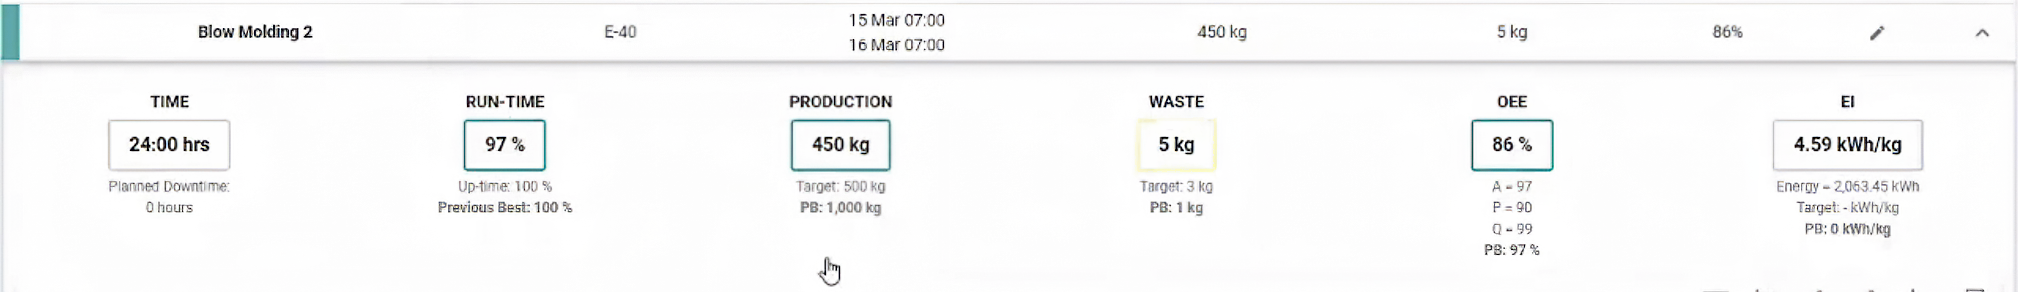
FactoryOps dashboard can help with sustainability programs by showing which machines are more energy-efficient than others.
These various ways of improving work flow can drive up to 20% revenue improvement, according to Dunford. Another important area of benefit is in sustainability, according to Allison Durbin, Guidewheel’s director of demand generation. Besides reducing waste through off-spec production, the system offers the ability to monitor kWh and kWh/lb for individual machines (Fig. 4). “You can’t control what you don’t measure,” she points out. The FactoryOps dashboard can help processors determine which machines are running more efficiently and which are “bad actors.” It also helps identify energy waste by machines that are idling for long periods of time.
How One Big Customer Put This to Use
Guidewheel currently works with over 90 manufacturers with over 140 plants in seven countries. These include numerous plastics compounders, extruders, thermoformers and injection and blow molders. They include some big names such as Chroma Color and Pretium Packaging.
Pretium is a major full-service designer and producer of blow molded containers and injection molded caps and jars. It currently has 28 plants in the U.S., Canada, Mexico and Europe. The St. Louis-based company has grown through several acquisitions—the most recent adding the nine plants of Alpha Packaging last year—which led its management to realize that it needed a standardized way of sharing process improvements across the company to achieve peak performance.
They wanted a way to measure the same things in the same way across all plants. Teams at the various plants were doing their best to identify and address issues, but they were relying on text, phone and email. Plant managers needed immediate visibility into which machines were working and when they were down so that they could respond accordingly. Around the start of 2020, Pretium began working with Guidewheel to implement FactoryOps on a pilot basis in two plants. Those test sites improved machine utilization by about 15% less than three months. Within a year, Guidewheel was in place in all of Pretium’s 19 plants and is now being rolled out to the nine former Alpha facilities, a transition that is expected to be complete by this month.
For multi-plant firms like Pretium, which has grown through acquisitions, it’s important that everyone monitors and records the same things in the same way.
Pretium assigned a continuous-improvement leader to the project to facilitate the rollout and ensure that every plant understood the goals and benefits of the Guidewheel system. Once it was installed, plants were able to start tracking downtime and categorizing what was causing machines to be down. Previously, people had “gut feelings” about what was causing downtime, but had no data-driven way to make decisions. Guidewheel ensures that everyone from the v.p. of operations to the plant manager and machine operators had the same source of information.
By analyzing their machine data through Guidewheel, Pretium determined that not all machines were operating at full capacity. By implementing efficiency improvements, they were able to get more out of their existing machines and avoid additional purchases. It has also facilitated knowledge sharing. While previously, plants within the same region were active in sharing best practices, that was hard to achieve across long distances.
“Downtime is tracked live down to the millisecond, and then we code that across more than 600 machines,” says Kris Nielsen, Pretium’s sr. v.p. of operations. “We are seeing hard data that shows we’re getting double-digit efficiciency and utilization improvements. We are logging reason codes for any downtime, such as scheduled downtime, changeovers, mechanical repairs and preventive maintenance. When we see facilities drift off their average, we can put an improvement project around that specific issue.”
Cynthia Melendez is plant manager in Anaheim, Calif., one of the first two pilot plants for Guidewheel at Pretium. All 24 molding machines there are monitored by Guidewheel. She says, “Even though we haven’t been using the system for a long time, it’s really helped us improve our utilization. We started at a low 60% utilization, and now we’re at mid-70s. And I can only see that improving with the real-time information that we’re getting day in and day out.” (Hear Melendez tell this story at short.ptonline.com/pretium-guidewheel.)
Nielsen notes that a test project in the St. Louis plant is monitoring auxiliary systems such as air compressors, tower water, chilled water and material loading systems to track uptime and downtime. Nielsen also anticipates sustainability improvements through use of Guidewheel. “We are measuring our electrical consumption at the millisecond level, and we can extend that down to the plant and even the product level. We know which machines are more energy efficient than others, so when we improve an underperforming machine, we can measure the new energy efficiency to see how much we’ve improved. Ultimately, we’d like to apply this information to reduce the amount of electricity needed to make a specific product.”
Pretium’s v.p. of marketing, Marny Bielefeldt, notes that Pretium supplements the production-monitoring function of Guidewheel with software for job scheduling and inventory control from vendors such as IQMS (now Delmiaworks), Oracle and others.


Related Content

Better Manufacturing Data Empowers Plastics Processors to Make Better Decisions
What’s needed to take all the data pulled from production planning, production monitoring and quality control systems and put it in the hands of the right people at the right time?
Read More
Why ‘Smart’ Blending May Be Right for You
Industry 4.0 smart controllers dial in the right recipes quickly with gain-in-weight blenders to eliminate material waste, cost overruns.
Read More
Paperless ‘Smart Factory’ Based on Automated Production Monitoring
Tier 1 automotive molder’s home-built production-monitoring and ERP systems, designed for “the little guy,” boost its efficiency rating and profits.
Read More
Five Places Where Automation Can Help...the Front Office
Say “manufacturing automation” and thoughts immediately go to the shop floor and specialized production equipment, robotics and material handling systems. But there is another realm of possible automation — the front office.
Read MoreRead Next

Machine Monitoring Becomes Simpler And More Affordable Than Ever
A new application of an established technology makes production monitoring accessible to any manufacturer, with any type of equipment, and in almost no setup time.
Read More
Speed to Market: Pretium Stays Light on Its Feet And Ahead of the Pack
A visit to its largest PET plant illustrates how this versatile blow molder leverages design skills, a can-do attitude, and a high degree of production flexibility to supply custom products in ever-shorter time windows. A new thrust into automation will help pick up the pace.
Read More
Pretium Packaging Expands PET Blow Molding
Based in Chesterfield, Mo., Pretium Packaging has invested $5 million in PET stretch-blow molding equipment and infrastructure at six of its 19 manufacturing locations in the U.S. and Canada.
Read More