


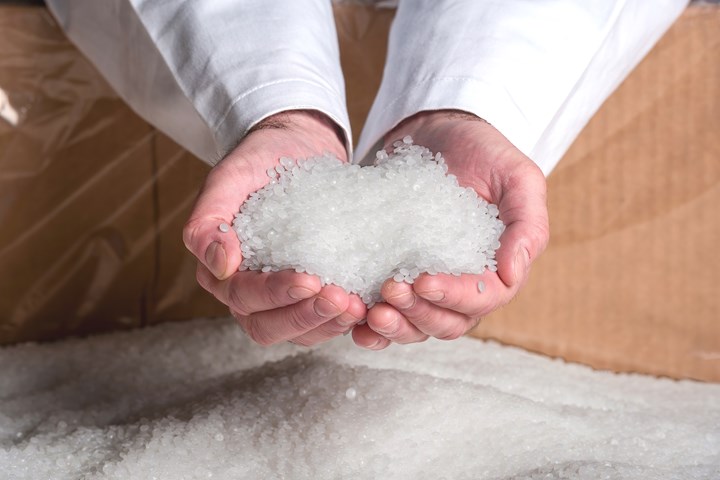
Color-measuring instruments can be particularly helpful in assessing color of recycled materials, to detect any color shifts or inconsistency. (Photo: Nova Chemicals)
If you are looking for ways to improve your color-evaluation process and make it consistent, consider using color-measurement instruments. This is becoming even more crucial with increased demand for post-consumer recycled (PCR) content, since recycled materials can exhibit color shifts and greater variability in color than virgin materials. If you are new to color measurement or already have a color program in place, there are a few things to consider in order to maximize your investment and ensure that you build an effective color program.
We know that not all people see color the same. We also know that evaluating materials under different light sources will influence how the color is perceived. In addition, the method used to evaluate the material can influence the visual evaluation. There are ASTM standards for visual evaluation (D1729, E1499) and definitions for illuminants to minimize the variables (ASTM E308 and ISO/CIE 10526). For visual evaluation, the human vision system is always a variable. There are color deficiency tests, but they still do not rule out other human factors such as fatigue, which can influence color evaluation.


In contrast, color-measurement instruments can eliminate the inherent variation of visual evaluation. Moreover, a color program can define the method of measurement to standardize color evaluation and communicate this throughout product development.
For PCR flake samples, use the largest measurement area, take multiple measurements, average them, and always present the same amount of product to the instrument.
Keys to Minimizing Color Variability
Whether for resins with PCR content or for virgin resins, the keys to minimizing variability in your color evaluation are to use the right color-measurement instrument (spectrophotometer—benchtop or hand-held) and to create good working methods, that is, establishing a standard operating procedure (SOP).
When contemplating color measurement to improve your color program, there are two factors that will help you determine the quality of the color-measurement instrument: repeatability and inter-instrument agreement (IIA).These metrics will give you an understanding of the precision and accuracy the instrument has to offer.
A repeatability test identifies the variation that the instrument introduces to the process. Some manufacturers publish this specification. It is important to know the test process if you are comparing this specification between instruments. For example, the Konica Minolta Sensing’s instrument brochures state that the test process is to take 30 measurements of a white tile with a 10-sec interval between measurements. The test has no operator interaction with the sample and indicates the consistency and precision of the instrument.
IIA indicates the difference between two instruments of the same model. This is often a total-color-difference equation value such as ∆Eab, ∆E00 or ∆E94. This metric value is important when you have two or more instruments and you are comparing data between them; it helps you understand the variability between the instruments. The smaller this number is, the better it is from a process standpoint.
It is also good to know how the manufacturer arrives at this specification. For example, Konica Minolta states it compares the measurements of 12 BCRA Series II tiles (BCRA-British Ceramic Research)—popular standards for color calibration that are considered invaluable for spectrophotometer evaluation—to the Master body, under the standard operating temperature and humidity range, as specified in the product brochure; and the color difference value is the average across the 12 tiles. An instrument with good IIA is an indicator of the precision of the instrument. The narrower your color tolerances are, the more accuracy and precision you want in your instrument.
When building your color program, it is important to know how the instrument performs with BCRA tiles and how it performs with the range of materials you will be measuring. Keys to ensuring that you are minimizing the variation in your measurement method are repeatability and reproducibility tests that inform and define your SOP.
The narrower your color tolerances are, the more accuracy and precision you want in your instrument.
Performing a repeatability test of the material you are measuring (not a flat white tile) will help you understand the instrument's precision with your material. A reproducibility test provides a general understanding of the variability introduced by the operator.
Typically, the material is measured 31 times (following Student’s t-distribution) lifting the sample off the instrument and then back to the instrument. This step requires defining the sample preparation presentation method to the instrument to make sure it is consistent, and that the settings and methods are optimized for the sample type. Preparation methods such as mixing, grinding, or cutting of the product need to be consistent. Presentation methods such as the amount of material compressed, measured with a backing material, in a glass or plastic Petri dish, need to be defined and consistent.
Measuring Recycled Materials
There are challenges in measuring PCR because it is not all homogeneous flat samples. In general, opaque samples are measured in reflection mode and translucent or transparent samples in transmission mode. Still, the samples can be prepared and presented to the instrument in a wide range of ways.
There are challenges in measuring PCR because it is not all homogeneous flat samples.
Let’s take a look at three different types of material typically found in the plastic recycling stream: flat chips, flakes, and pellets:
Pellets can also be a challenge. Measure this type of sample in a Petri dish, take multiple measurements, rotate, and average the measurement to provide readings representing the sample.
▪ Flat chips that are opaque are measured in reflectance mode. However, if the chip is not opaque and is too small to measure in transmission, then sample presentation needs to be considered and defined. An opacity value of 100 is opaque, but suppose a sample has an opacity value of 12.83. Either making the sample thicker to make it more opaque or using a white backing material when measuring the sample would provide consistency in measurement. You would not want to compare data where the sample presentation varied on this sample, as the method could then introduce errors. Here’s an example:
L* a* b*
Single flat part, no backing 62.09 -2.45 -7.38
Single flat part with white backing 73.29 -2.02 -1.96
Three flat parts stacked 66.85 -2.49 -5.97
As shown here, the single part measured without a backing, with a white backing, or three parts stacked together all provide different CIELAB values. (The CIELAB color space, also referred to as L*a*b*, was defined by the International Commission on Illumination (CIE) in 1976. It expresses color as three values: L* for perceptual lightness; and a* and b* for the four unique colors of human vision: red, green, blue, and yellow.)
Sample presentation matters, so it must be documented and designed to reflect what you need to discern about the material or parts you are measuring.
Recommendation: When measuring materials that are not completely opaque in reflection mode, use a technique that ensures you are consistent in sample presentation to the instrument.
You can improve your color program by introducing color measurement that is precise and accurate.
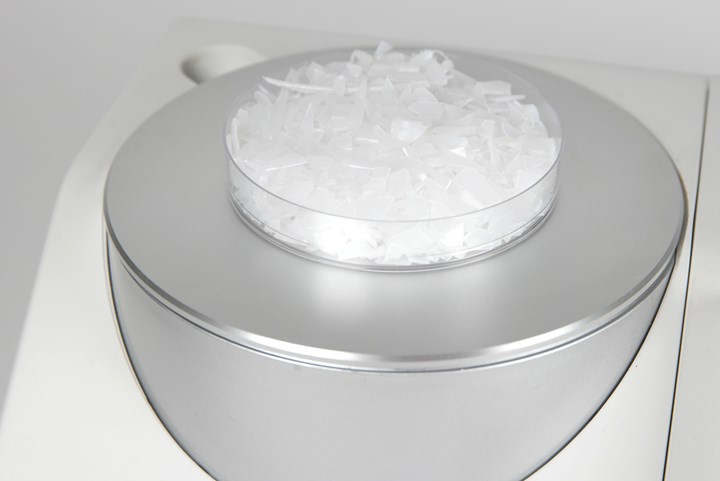
▪ Flake is a challenge because it is small and cannot be measured in transmission, although it is typically translucent. In this case, where the product is not homogeneous, there are sample-preparation and instrument settings that can reduce the variation in sample measurement. The average of multiple measurements, the amount of product presented to the instrument, and using the largest measurement area available are measurement methods often used for this type of sample.
Recommendation: Use the largest measurement area, take multiple measurements, average them, and always present the same amount of product to the instrument.
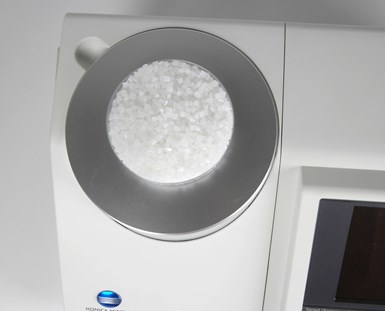
▪ Pellets can also be a challenge because the light will bounce around the pellets and cause variation from measurement to measurement.
Recommendation: Measure this type of sample in a Petri dish, take multiple measurements, rotate, and average the measurement to provide readings representing the sample.
Below are four tables with repeatability and reproducibility test results for HDPE flake and pellet material. THey show 31 measurements of samples placed in a petri dish. This information provides insight into variation introduced by the measurement method. In this test the samples were put in a petri dish, with the same amount of material in the dish for both the repeatability and reproducibility test. This is not a quality-control check of a batch to a standard. Quality control (QC) software provides this type of comparison, in which other values would be considered. With QC software you can look at the difference values, absolute CIELAB values, and color-difference equations. Here we are just comparing the CIELAB value variation over the 31 measurements.
Table 1 shows flake repeatability test results whereby the sample is not moved between measurements. It reports the maximum L* value as 84.34 and the minimum L* value as 84.33, which gives us a range in lightness values of 0.01. The a* and b* values also have a very small range of 0.01. The Standard Deviation for L* is 0.0016. The standard deviation for a* is 0.0036 and b* is 0.0034. The readings show a low variation, confirming the instrument’s repeatability.
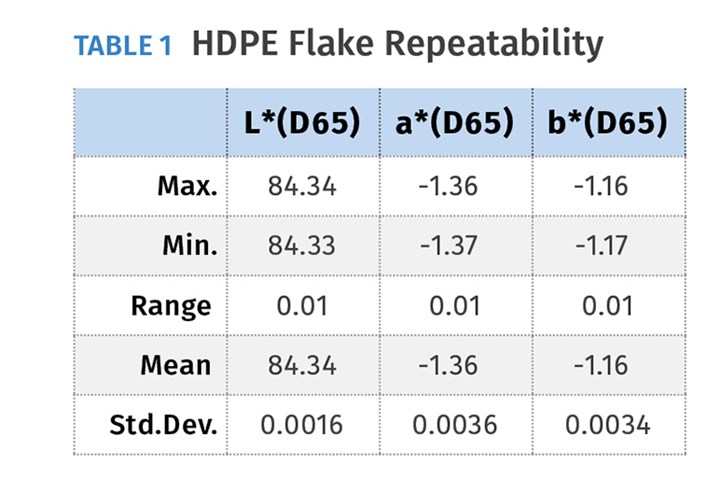
Table 2 shows the flake reproducibility test whereby the sample is measured by moving it off the instrument and putting it back onto the instrument between each measurement. In this test the flake was put in a petri dish measured in reflection mode and is moved between measurements. This provides an understanding of the amount of variation introduce by human interaction and sample presentation to the instrument. The results show a 0.25 range in the highest and lowest L* values. The a* range is 0.08 between the maximum value of -1.31 and the lowest value -1.39. The b* value ranges between -1.00 and -1.18 over the 31 measurements taken in the test. Overall, this shows that the variations is not large, so the sample presentation and preparation methods are good.
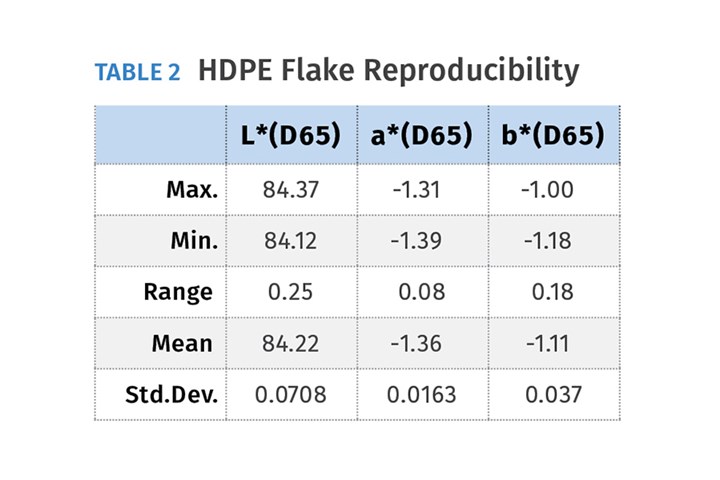
The tests give insight to the variation in the instrument and variation introduced by the method of sample presentation. If the differences were higher, you could go back and look at changes in the sample preparation and presentation to reduce the variation. Changes could be averaging several measurements, using a larger measurement area, or rotating the sample.
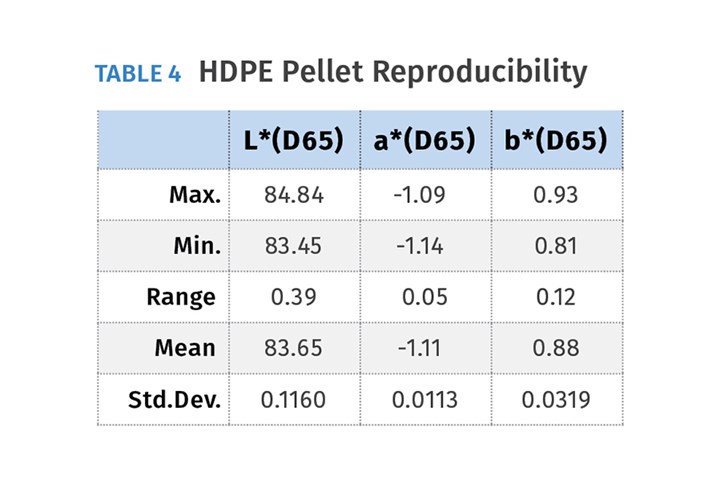
Tables 3 and 4 provide the statistics of the 31 measurements of the pellet material placed in a petri dish. There is a lower standard deviation in the repeatability test than in the reproducibility test, which is expected with good quality instruments. If the range of measurements needs to be minimized, then other measurement methods could be used—for example using a deeper petri dish and a thicker sample.
Table 3 shows results of the pellet repeatability test. The sample is not moved between the 31 measurements. The range of highest and lowest value for L*and a* was 0.01 and the range for b* was 0.02.
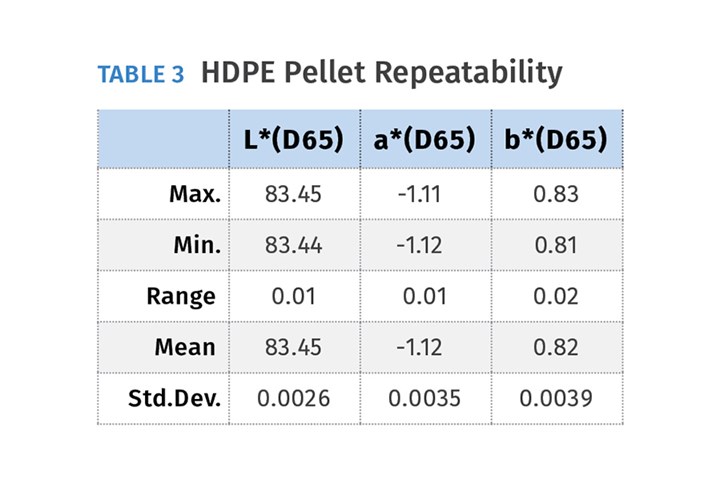
Table 4 shows results of the reproducibility test for the pellet samples. These samples were measured 31 times and the petri dish was moved between measurements. The L* value has a range of 0.39 between the highest and lowest values. The mean value of all the measurements is 83.65. The range between the maximum and minimum a* value is 0.05. The mean value for all the measurements is -1.11. The range for the b* values is 0.12. The highest is 0.93 and the lowest is 0.81. The average of all 31 measurements is 0.88.
You do not have to be limited by the variables of visual color evaluation. You can improve your color program by introducing instrumented color measurement that is precise and accurate. Looking at the instrument's specifications and performing the repeatability and inter-instrument agreement (IIA) tests will provide a good understanding of the instrument’s performance.
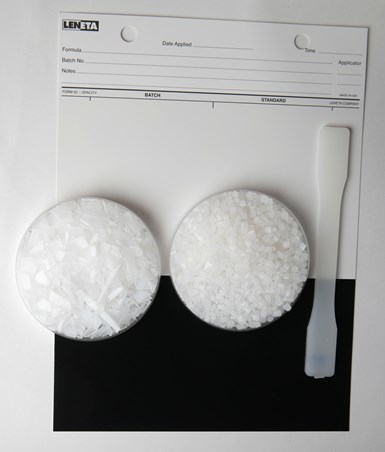
When measuring materials—shown here in flat chips, flakes, and pellets--that are not completely opaque in reflection mode, use a technique that ensures you are consistent in sample presentation to the instrument.
Good sample preparation and presentation methods can help you quickly determine the differences between the approved standard and the individual batches in order to quantify the color and quality in quality-control software. Color-measurement and quality-control software can improve your color communication and enhance a color program in evaluating recycled plastics.
ABOUT THE AUTHOR: Jodi Baker is senior applications engineer at Konica Minolta Sensing Americas, Inc. She has 20 years of experience in color reproduction in the graphic arts and digital imaging industry. Baker is responsible for troubleshooting customer issues with color-measurement software and hardware, as well as working with customers to find the right solutions for their color-measurement needs.


Related Content

Avient Receives PLASTICS’ 2023 Re|Focus Sustainability Innovation in Design Award
Said to be the first digital tool of its kind, the award was for Avient’s post-consumer recycled resin Color Prediction Service.
Read More
Next-Generation Industrial Desktop 3D Scanner for QC
Exact Metrology’s newest version of Artec Micro boasts ultra-high precision.
Read More
Dual-Mode Portable Thickness Gauge for Packaging
Hand-held “pen” measures sheets, containers, panels, large parts with magnetic or capacitance mode; controlled by Bluetooth phone app.
Read More
Fast, Simple QC Method Directly Quantifies Recycled Content in Plastics
Novel fluorescence-based spin-out technology provides a rapid and reliable method to measure and certify recycled content in a wide range of plastics.
Read MoreRead Next

Avoid These Three Mistakes to Get the Most from Color
Here are the key misconceptions and common practices that keep processors from reaching the heights of coloring proficiency. Find out if you’re stumbling into these pitfalls, and learn how and why you should swerve around them
Read More
Five Effective Ways to Control Color
A 50-year veteran in color-concentrate production and use shares practices to help you make better color decisions and generate less scrap. To specify color correctly and communicate your specs to your color supplier requires understanding of the “Five U’s.”
Read More
Understanding the ‘Science’ of Color
And as with all sciences, there are fundamentals that must be considered to do color right. Here’s a helpful start.
Read More