
INJECTION MOLDING: Do You Need to Profile Injection Velocity?
Look at the parts. If the answer is yes, the on-machine viscosity curve can help.
.jpg;width=70;height=70;mode=crop;format=webp)
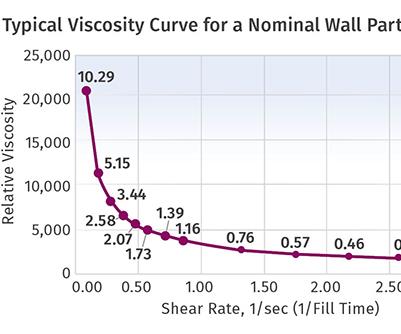
The viscosity curve is a plot of the polymer viscosity vs. shear rate. Data is plotted here on linear scales rather than the log-log method.
Make a series of short shots to determine whether you need to profile injection velocity. Align them identically, and evaluate each part for a quality variation. Ignore size variations, look only for issues that are important to the part. If there is an issue at one velocity and not at others, you may need to profile injection.


Let us take a step back in the development of Scientific Molding with a review of one of the benchmarks, the on-machine viscosity curve. It was not all that well accepted when first presented in the late 1980s, but 20 some years later it has gained a substantial foothold and perhaps now is even a bit overused for purposes that were not its primary function.
There is more to it than finding a starting point for determining fill time. It has value in determining whether you should profile injection speeds. Develop the curve by using an injection molding machine as a rheometer and plot the data on linear scales. It is more correct to plot this log-log, but I like the linear plot as it shows the magnitude of viscosity variation, not just the percentage change as you vary fill time or shear rate. It is important that you get the data by reducing the second-stage pack and hold pressure to a very low number and leaving some time on the hold timer. Figure 1 is representative of a typical viscosity curve. How can this viscosity curve tell you whether you need to profile injection? And if so, how do you do it?


Most machines today have five to 10 velocity steps available for profiling part filling. When do you change speeds and what speeds should you use? How many hours have you lost to trial and error on this function? Some processors spend hours at this, wasting time, resin, and money. Worse, they change profiles during and between shifts. Some molders feel that if there are 10 velocity steps available, they should use all 10. They even feel that a machine with 10 velocity steps is better than a machine with only five. Sorry, but in my career I believe the most I have ever used was four.
Perhaps even more startling is that over 80% of all processes I set up use only one fill velocity. In addition, most of the time when I have to profile injection velocities, it is to process around a design or tooling issue. Those that know me can tell you I am not a happy camper when this happens, as it is my policy to fix the problem rather than process around it. Quality and production rates will be significantly better and the parts will be cheaper in the long run. Yes, I know tooling work is expensive, but the seconds lost in cycle time amount to even higher dollar values.
Quality, production rates, and costs are not the only reasons I do not like to profile injection. Perhaps the biggest is the difficulty in setting the job up again on the same or another machine. Transferring velocities and positions to change velocity is a bloody nightmare if you are using millimeters or inches for stroke measurement. The only way to do it is to make short shots at each velocity change and weigh and snap a picture of the part, noting fill time for each.
Now consider the time to set it up that same way on the same or different machine. If you think you can just save the setup recipe to the computer and pull it up the next time the mold goes into production, think again. There’s a difference between machine setpoints and actual results. Machine controllers store setpoints, not actual results.
So, does the viscosity curve provide information that will alleviate this processing quagmire? The answer is yes, but it is not in the calculations. Look at the parts—they provide the data; and I urge you to save them or at the very least retain pictures of them. Line them up slow to fast or vice versa. They should be a series of short shots that vary in size based on how full they are. The part at the highest speed should be 99% full by volume, visibly short, not just sinky. The rest of the parts, as you go to slower velocities (longer fill times), should trend shorter or smaller.
Make sure that in doing the experiment you took fill times out to several seconds, beyond what you would normally consider appropriate for the part. Some thin-walled parts are an exception (as is micromolding) due to freezing off, shorter fill times, or the inability to separate fill from pack and hold. Parts made at the longer fill times may be too short to evaluate properly, so you may have to redo those velocities at a stroke cutoff or position transfer that makes a larger part, but one that is still short. Do not use the data from these parts for the viscosity-curve calculation.
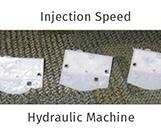
Figure 2 presents a typical sequence of parts. Once you have this sequence of parts, you can evaluate them for the decision to profile injection.
With the parts arranged in sequence and aligned identically, evaluate each part for quality variations. Ignore size variations. Look for blush, flash, halos, splay, streaks, bubbles, or whatever is important to part quality. If there is an issue at one velocity and not at others, you may need to profile injection. If there is no variation between the parts other than size, you have your answer: Velocity does not influence whatever is wrong with these shorts. In such cases, use one velocity.
If parts made at a particular velocity or range of speeds have flash or burns, and the others do not, you do not need to profile velocity, as those are mold issues. For a short shot with flash, 95% of time you have a weak parting line. Why? If the part is short and it is not thin-wall, there is very little pressure on the parting line. Pressure does not develop on the parting line until the cavity is full, so fix the parting line.
Same goes for burns. Burns are a venting issue; vent that area or, if that cannot be done, try pulling a vacuum on the cavity.
If you see blush, halos, streaks, and discolorations that occur at some but not all velocities—there may be a reason to profile injection speed if you have no tool or resin remedy available. This procedure requires little or no experimentation: You will see which velocity presents the problem and which velocity does not. You also can easily find the position to change velocity by the location of the defect, then adjust the transfer position to match that location.
Bottom line: The viscosity curve produces parts that if studied properly can provide the information needed to decide whether you need to profile velocity. The curve will also tell you what velocities are needed at which position. Remember to use one velocity if possible; a simple process is more elegant.
ABOUT THE AUTHOR
John Bozzelli is the founder of Injection Molding Solutions (Scientific Molding) in Midland, Mich., a provider of training and consulting services to injection molders, including LIMS, and other specialties. E-mail john@scientificmolding.com or visit scientificmolding.com.


Related Content

Moving Beyond the Relative Viscosity Curve — New Method To Find Optimum Plastic Flow Rates: Part 2
Explore the use of the injection unit velocity capability, which determines a machine’s injection speed linearity to find optimum flow rates, and proposes a second method.
Read More
Online Versions of Process Development Course and Software Launch
NPE2024: FimmTech is introducing online versions of its Nautilus process development software as well as its Scientific Molding and Design of Experiments (DOE) process development course.
Read More
Use These 7 Parameters to Unravel the Melt Temperature Mystery
Despite its integral role in a stable process and consistent parts, true melt temperature in injection molding can be an enigma. Learning more about these seven parameters may help you solve the puzzle.
Read MoreRead Next

People 4.0 – How to Get Buy-In from Your Staff for Industry 4.0 Systems
Implementing a production monitoring system as the foundation of a ‘smart factory’ is about integrating people with new technology as much as it is about integrating machines and computers. Here are tips from a company that has gone through the process.
Read More
Lead the Conversation, Change the Conversation
Coverage of single-use plastics can be both misleading and demoralizing. Here are 10 tips for changing the perception of the plastics industry at your company and in your community.
Read More