
Creating a Capable Process Using Process Capability
Know your Cp from your Cpk and how parts can meet dimensional specifications but still not be “capable.”


Most plastics processors are not statisticians. When I started my second job as a process engineer, I was asked to launch production on a new mold. I got the mold running and submitted a set of parts to the quality department to have the dimensions measured. When I asked about the results, the inspector told me, “The parts are in spec but not capable—they failed inspection.” Needless to say, I was thoroughly confused.
The dimensions were within the required specifications between the Lower Spec Limit (LSL) and the Upper Spec Limit (USL), so I figured my work was done. I pointed this out to the quality engineer, but he said, “Sorry, Mr. New Guy—the dimensions are in spec, but they are not capable. You need to make them capable.” Since I still had no idea what he was talking about, I asked him to explain, and he did. That was the day when I started to understand quality systems.


In a capable process, all parts fall within the upper and lower specification limits. (Images: Suhas Kulkarni)
The Inevitability of Variation
Variation is natural. If you say the time it takes you to get to work is 30 minutes, then that 30-minute number is the average of the times it took you get to work in the last few weeks, months or years. There have been days you got to work in 29 or 28 or even 25 minutes on the low side and maybe as much as 35 minutes on the high side. This is natural variation that we cannot control. The commute time is subject to traffic, lights, road conditions, weather and so on. If you weigh 100 consecutive shots from a molding machine, you will see that there is a variation in the weights even though you have not touched the molding process. Variation is everywhere.
If you extend this concept of variation to part dimensions, you will see the same result. Measure 100 consecutive parts for a given dimension, and you will see that there is a variation in the part dimensions. Most of the dimensions will be centered around the average, but there will be ones at the low and high ends.
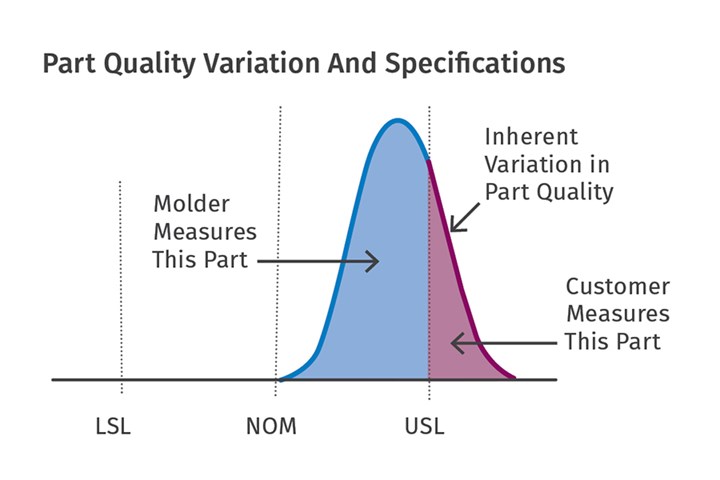
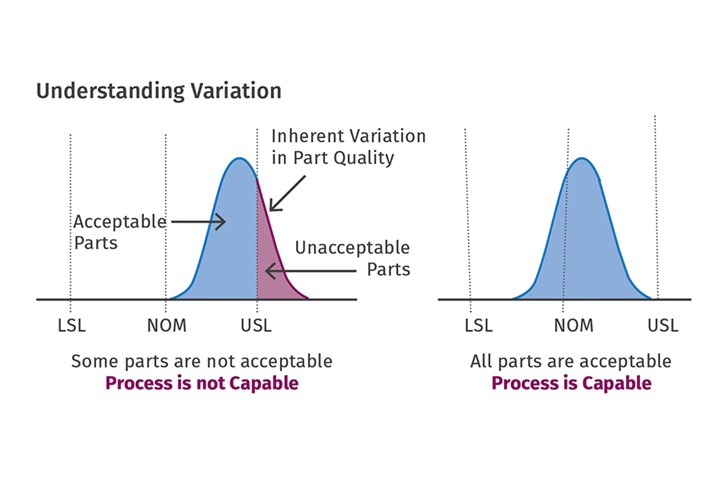
FIG 1 If any portion of a process lies outside the upper and lower specification limits, there is a chance out-of-spec parts will make it to the customer.
If you measure three parts from the green area of the graph in Fig. 1, you would think that all the parts are acceptable, and so the entire production run is acceptable. However, there will be parts out of specification that are in the red area of the graph. Unfortunately, these will be the ones that your customer will find. Clearly, if some of the spread is outside the spec limits, then the process is not capable of molding acceptable parts. If the entire spread is within the spec limits, then we can say that the process is capable of molding parts that will always be within the specifications. The ability to mold parts within specifications is called Process Capability. Let us understand this further by starting with some definitions.
Please note that the definitions and explanations here are simplified for the understanding of processing personnel and may not match the classical definitions that the quality engineers and statisticians are used to.
Normal Distribution: If 100 parts are measured for a given dimension, then there will be variation in the dimensions. In this case, the average of the measured dimension is 24.15 mm, with an equal number of parts below and above 24.15 mm. This variation in the dimension is a result of the normal process variation, and the distribution is therefore called a normal variation. The distribution’s bell-like shape is what it derives its name from: the bell curve.
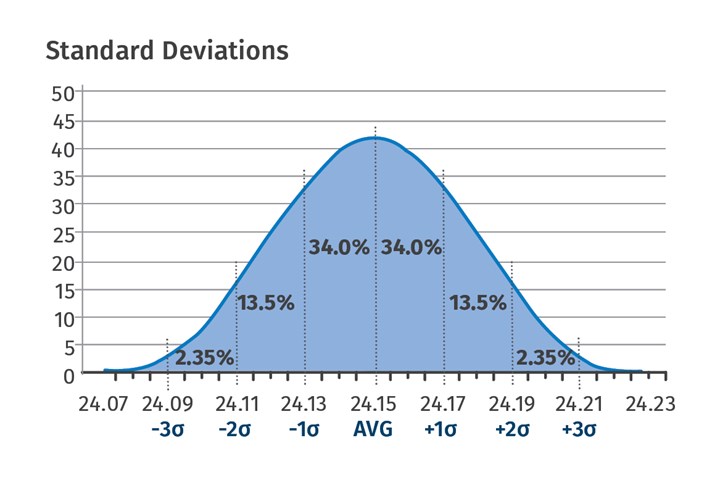
FIG 2 Molders are not statisticians, but a working understanding of concepts like standard deviation is key to process capability.
Standard Deviation: If we take the bell curve in Fig. 2 and draw seven equidistant lines as shown, then we end up covering 99.7% of the area under the curve. The center line is where the average of the data lies. The distance between two consecutive lines is called one standard deviation. In this case, the average is 24.15 mm, and the standard deviation is 0.02 mm. The Greek letter sigma (σ) is the symbol for standard deviation. Considering the average to be at a zero point, we have three standard deviations on the right of the average (+3σ), and three standard deviations to the left of the average (-3σ).
We can therefore say that 99.7% of the measurements lie between +3σ and -3σ and 0.3% of the data is outside +3σ and -3σ. Notice the distance between +3σ and -3σ is 6σ. We can also say in layman’s terms that 6σ is the total spread of the data (ignoring the 0.3%).
Process Capability: In simple terms, if 100% of the measurements lie within the USL and the LSL, then we say the process is capable of molding parts to the required specifications with no possibility of the parts being out of spec. However this needs to be quantified: How capable is the process? Statisticians quantify this by two indices: Capability Index, abbreviated as Cp, and Process Capability Index abbreviated as Cpk.
Capability Index is the ability of the process to mold parts whose variations lie within the tolerance limits. The key word here is “ability.” Is the process able to mold parts with a natural variation that is less than the tolerance? If the natural variation is 0.30 mm and the total tolerance 0.20 mm, then it is clear that there will be parts out of specifications. But if the variation is only 0.10 mm, then there is a strong possibility that all the parts can be within specifications (as long as the spread and tolerances overlap). More on this later.
Capability Index is calculated with the following formula:
Capability Index = Engineering Requirements / Statistical Requirements
Engineering requirements mean that the dimensions should be between the USL and the LSL or within the total tolerances. Statistical requirements mean that the dimensions should be between +3σ and -3σ or a total distance of 6σ.
Therefore, Cp = USL – LSL / 6σ, so that if the total tolerance is higher than the spread (6σ), the Cp value will be higher than 1, if not less than 1. If the Cp value is equal to 1, the spread is exactly equal to the total tolerance.
The total tolerance in Fig. 3 is 0.20 mm. The spread for Process 1 is 0.30 mm and is greater than the tolerances, so Process 1 will never be able to mold all the parts to specifications. However, the spread for Process 2 is 0.10 mm, and therefore Process 2 will be able to contain the variation within the specifications and potentially mold all the parts to specifications. Cp1 is less than Cp2. Remember that we said 99.7% of the data is between -3σ and +3σ. To get the remaining 0.3% of the data within specifications, one more standard deviation is added, and now the requirement becomes -4σ to +4σ. With these new limits, if the calculated Cp value is 1.33, then the molder can be confident that the process is able to mold the parts within dimensions.
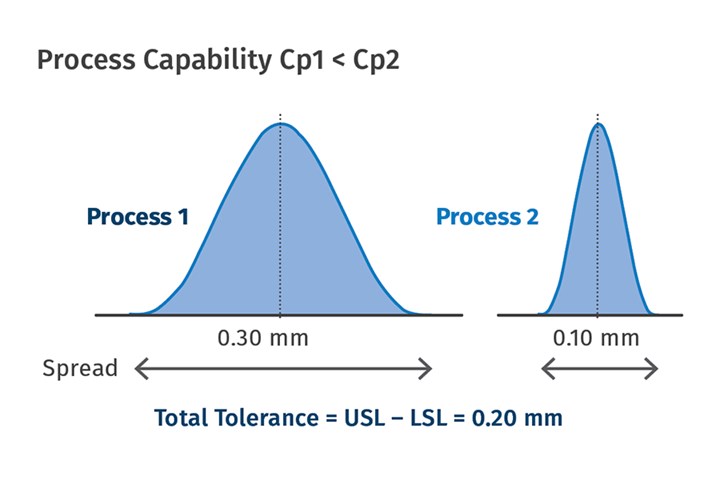
FIG 3 Calculating the capability index (Cp) requires molders to know the engineering and statistical requirements for the part.
Process Capability Index: For the Capability Index discussed above, the key word is “ability.” We did not discuss whether the parts actually met the specifications. We only considered whether the natural spread in the data was less than the total available tolerance. For each of the three processes in Fig. 4, the tolerances and the spread are identical, and therefore the Cp values are identical. However only Process 3 can mold all the parts to meet the specifications. To take into consideration how close the dimensions are to the specifications, we utilize Process Capability Index (Cpk). It is calculated using the equation:
Cpk = (USL - X̄)/3σ
or
Cpk = (X̄ - LSL)/3σ (whichever is smaller).
Where X̄ (X bar) is the average of the data.
As with the 1.33 value above for the Cp, if the calculated value of Cpk is 1.33 (or more) then all the parts will be within specifications. At a value of Cpk = 1.00, 99.7% of the parts will be within specification. Note that we are not talking about the ability of the process to mold parts with the variation less than the tolerances, but rather we’re talking about the confidence that the molded parts will be within specifications and have an acceptable variation. The higher the Cpk, the more confident we can be that the molded parts will be in specification.
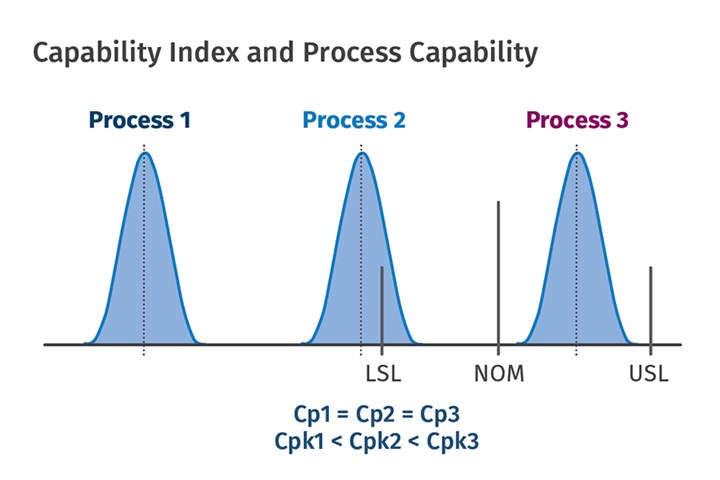
FIG 4 The Process Capability Index (Cpk) examines how close dimensions are to specifications.
For a given part, there are some dimensions that need to meet spec: For example, an outer dimension of a box cover. It is not a functional dimension. However, the inner dimension of all the molded covers must be in spec or else the cover will not snap properly onto the box. In such cases, a minimum Cpk value of 1.33 will ensure that all the molded parts will be within specifications. This is for one given production run. To take into account the long-term variations from run to run or for very long runs, some quality engineers will add on one more standard deviation as a cushion. This equates to a CpK value of 1.67.
In closing, Cp is the ability of the process to mold parts within the available tolerances, not absolute specifications. CpK is the ability of the process to mold parts within the available tolerances and meet the specifications.
ABOUT THE AUTHOR: Suhas Kulkarni is the founder and president of Fimmtech, San Diego, an injection molding service-oriented firm focusing on Scientific Molding. Fimmtech has developed several custom tools that help molders develop robust processes, and its seminars have trained hundreds of individuals. Kulkarni is an author of the best-selling book, Robust Process Development and Scientific Molding, published by Hanser Publications. Contact: (760) 525–9053; suhas@fimmtech.com; fimmtech.com.


Related Content

Moving Beyond the Relative Viscosity Curve — Determining Optimum Plastic Flow Rates: Part 1
Should injection molders consider using a range of plastic flow rates, versus the selection of one plastic flow rate from the relative viscosity curve?
Read More
Using Data to Pinpoint Cosmetic Defect Causes in Injection Molded Parts
Taking a step back and identifying the root cause of a cosmetic flaw can help molders focus on what corrective actions need to be taken.
Read More
Understanding the Effect of Pressure Losses on Injection Molded Parts
The compressibility of plastics as a class of materials means the pressure punched into the machine control and the pressure the melt experiences at the end of fill within the mold will be very different. What does this difference mean for process consistency and part quality?
Read More
Diagnosing Defects: Determine True Root Cause Before Adjusting a Process
Common defects can have common causes — flash equals worn mold shutoffs, right? Except when they don’t. Trust your eyes, but verify the root cause before adjusting a process.
Read MoreRead Next

Process Capability and the ‘Hesitation Effect’
Understanding the concepts of pack and hold and applying them during process development is critical for molders to achieve consistent part quality.
Read More
Improving Molding Process Capability: Understanding the PVT Graph, Part 1
Process capability is related to the variation in part dimensions from shot to shot. High values of process capability require the shrinkage of the material to be identical on each shot, which can be confirmed from the pressure-volume-temperature (PVT) graph.
Read More
A Systematic Approach to Process Development
The path to a no-baby-sitting injection molding process is paved with data and can be found by following certain steps.
Read More