Using Data to Pinpoint Cosmetic Defect Causes in Injection Molded Parts
Taking a step back and identifying the root cause of a cosmetic flaw can help molders focus on what corrective actions need to be taken.


Often in injection molding it is assumed that part rejection, or low yield, is a result of nonconformance to dimensions and excessive warpage. However, many times, and sometimes more often with molded plastic components, parts are rejected due to cosmetic issues. Whether there is a black speck in a transparent part or color or gloss variation from shot-to-shot, once these issues arise there tends to be a lot of finger pointing.
Additionally, with the cosmetic aspects of molding still considered more of an art than a science, the corrective action tends to result in many investigation avenues being identified and pursued. This leads to significant cost and time delays in the project. This article highlights, through case studies, how taking a step back and identifying the root cause of the issue can help focus the direction of those corrective actions.


Where to Start?
In general, the first step in any cosmetic investigation is a robust visual inspection. While this may seem obvious, a thorough visual analysis can provide a wealth of information to both rule out and hone in on potential cause(s) of defects. A well-run visual investigation may include use of different light sources, examination of physical cross-sections and use of microscopes.
However, in all cases, this initial assessment should include higher magnification investigation (such as optical or scanning electron microscopy) to visualize the defect and enable proper identification of the issue at play. The goal is to understand the physical characteristics of the defect; the interaction of the defect with the base polymer; and the pervasiveness of the cosmetic issue.
With a true understanding of the physical nature of the defect, the field of investigation should already be narrowed. However, getting to root cause typically requires some form of compositional or analytical testing to help prove or disprove hypotheses formed during the visual assessment.
While the correct method is dependent on the specific issue observed, some examples of testing that can help to further pinpoint the issue are Fourier-Transform Infrared Spectroscopy (FTIR), Differential Scanning Calorimetry (DSC), Thermogravimetric Analysis (TGA), Melt Flow Rate (MFR) and Energy Dispersive X-ray Spectroscopy (EDS), to name just a few.
In many cases, only one or two of these tests are required to greatly reduce the required troubleshooting at the press. With a small amount of data, the investigation can be taken from dozens of avenues in material, molding parameters, mold design and potential contamination to just a few likely culprits.
Getting to root cause typically requires some form of compositional or analytical testing.
To further show how a small amount of data can speed up root cause investigations, we will present a few case studies where the above-described analyses helped to identify the cause of the cosmetic issues.
Encapsulated Black Specs
A part was submitted for a visual defect analysis that was manufactured from a PC with added colorant or fillers. Visual investigation showed several black particles that were encapsulated in the part wall at multiple locations (Fig. 1).
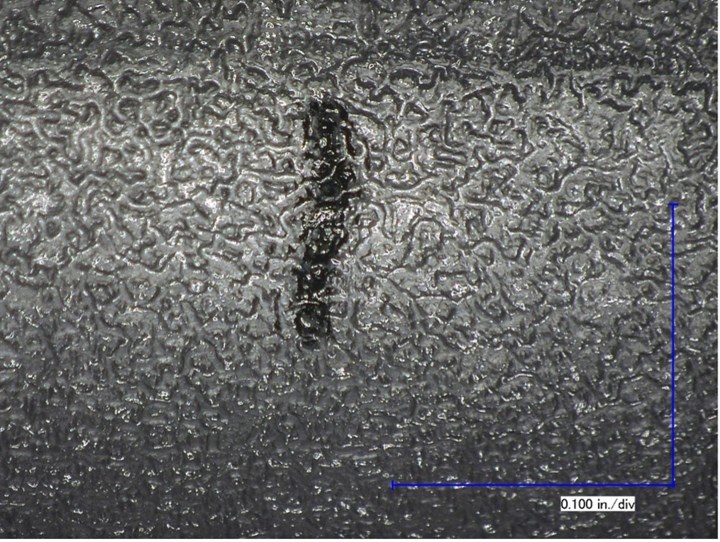
FIG 1 An external view of the black particulate, showing full encapsulation in the clear polycarbonate material. Images: The Madison Group
The black particle showed clear edges with limited visual indications of melting/flowing during the molding process. Additionally, the cross-sectional analysis showed minimal interaction of the particle with the base resin (Fig. 2).
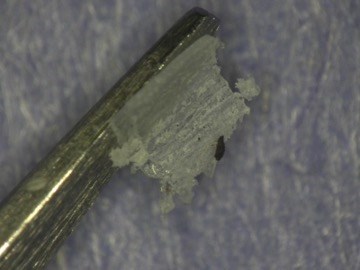
FIG 2 Sectioning analysis showed that the material was not well adhered to the base resin, suggesting it was not melted during the molding process.
Utilizing a scanning electron microscope (SEM) and EDS highlighted that the particle was a single solid material rather than an agglomeration of smaller particulates and was likely organic in nature (Fig. 3).
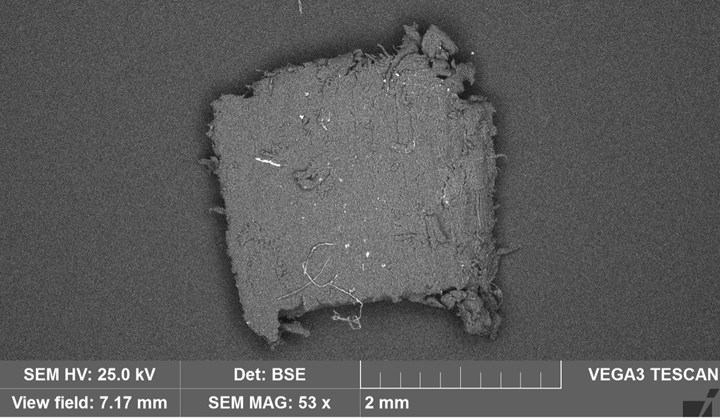
FIG 3 The SEM analysis showed similar coloration between the base resin and contaminant. This suggested that the contaminant was organic and not inorganic in nature.
In general, these characteristics suggested a polymeric or higher molecular weight material that did not melt at the PC process temperatures and was not fully miscible with the resin. This visual analysis rules out sources such as lower molecular weight viscous fluids, inorganic substances and agglomeration of additives such as carbon black.
To further investigate the chemical makeup of the black particle, the contaminant was removed from the part and analyzed via FTIR (Fig. 4). The top, red spectrum represents the analysis of the part remote from the black particles. The observed peaks were characteristic of a PC, as expected from the material. Comparison of this spectrum with the spectrum from the extracted particles showed a significantly different chemical makeup for the black particles.
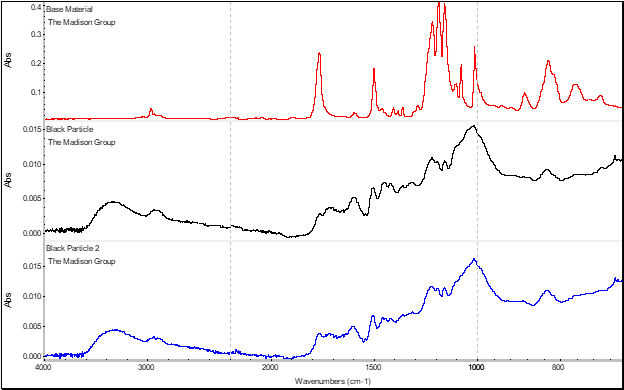
FIG 4 FTIR analysis of the base material and black particles showed a significant difference in the chemical makeup. This showed that the particles were external contaminants.
Subsequent analysis and interpretation of the black particle spectra showed that the observed peaks were characteristic of a wood-flour type substance (Fig. 5). This type of chemical identification could suggest the particle was from chipboard, cardboard or other cellulosic sources. With this information, the sources of potential contamination on the manufacturing floor were limited to looking for how this type of material could get into the material stream.
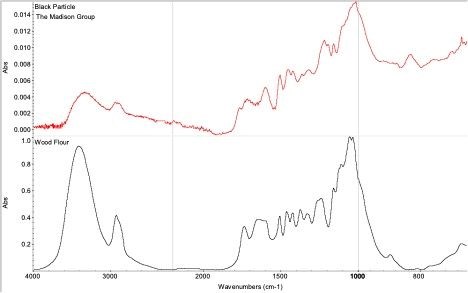
FIG 5 Spectra interpretation and analysis showed the particulate matched well with a wood-flour material. This could suggest sources such as chipboard or other cellulosic-based materials.
Surface Discoloration
A PE sheet was submitted that showed a yellow discoloration present on the external surface in multiple locations (Fig. 6A). It was indicated that the parts looked completely normal directly after molding, and the defect appeared during storage.
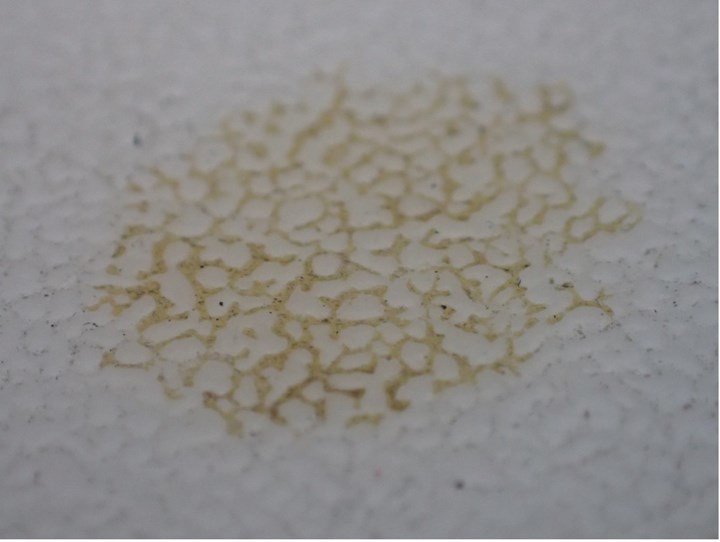
FIG 6A External view showing a yellow discoloration on the surface of the PE sheet.
Visual investigation revealed that the contamination was mostly present within the valleys of the surface texture. A cross section of the defect region showed the discoloration was indeed contained to the surface of the component (Fig. 6B). These observations suggested the substance was not miscible with or chemically attracted to the base material. Based on these visual characteristics, effects such as external contamination or additive blooming effects could result in the observed defect.
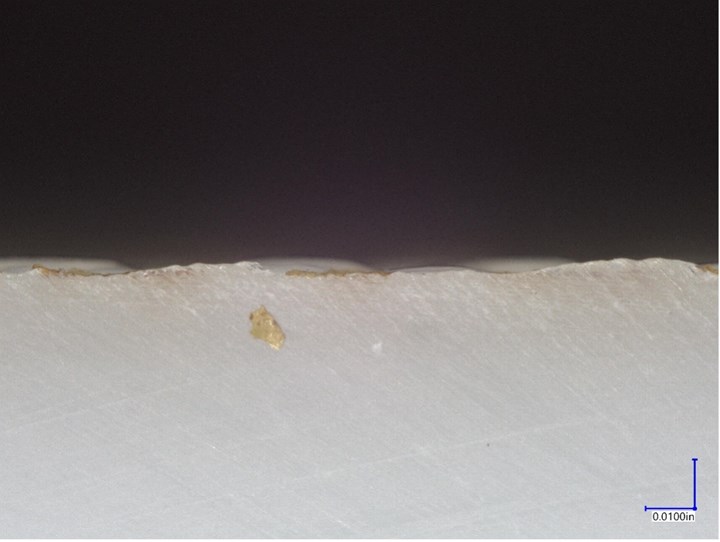
FIG 6B Cross-section view showing no signs of penetration of the surface discoloration into the thickness of the material.
FTIR testing was again selected as the analytical technique to investigate the defect region further. The analysis of the base material showed peaks expected of a PE material. However, comparison to the discolored regions of the part showed significant additional peaks that suggested an external contamination and not an additive bloom/agglomeration effect (Fig. 7).
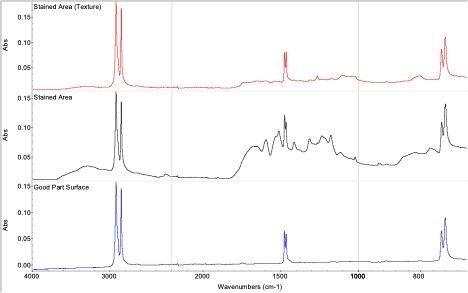
FIG 7 FTIR comparison of the stained region to the non-stained region of the part showed significant additional absorption bands. This suggested that additional chemical substances were present on the discolored surface.
Subsequent interpretation showed the surface contaminants were consistent with both silicone and urethane-based substances (Fig. 8). This matched well with a sealant utilized during the assembly of the parts after molding but prior to storage. Based on the findings of the analytical testing, it was determined that exposure to UV light during storage caused the observed yellow discoloration.
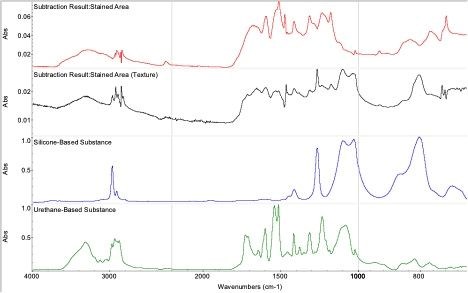
FIG 8 Subsequent spectral interpretation showed absorption bands that were characteristic of a urethane-based substance and a silicone-based fluid.
Color Variation
The final case study highlights a component where the customer was having poor color consistency in a molded part. A mold was built and being qualified for production. However, the part was exhibiting poor surface aesthetics along its top edge, leading to poor part yield. The part was specified as being manufactured from an unfilled polyamide with a flame retardant in it. The material came pre-colored from the material supplier and had been dried prior to molding. The visual inspection revealed the discoloration was isolated to the areas directly in front of the gates, where the plastic begins to form the part (Fig. 9).
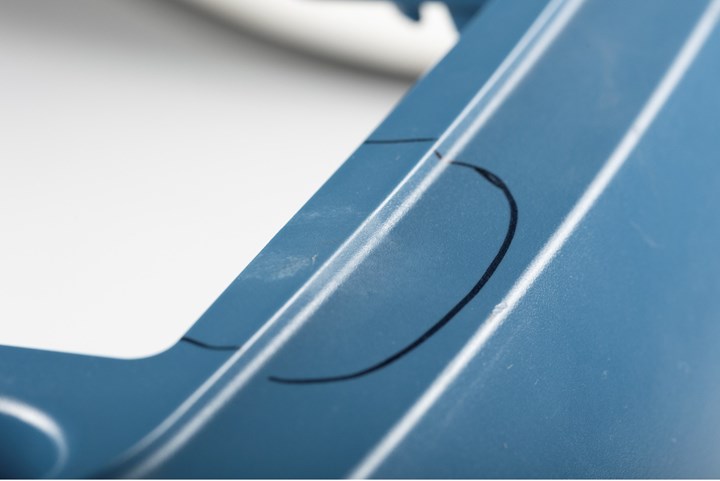
FIG 9 Excessive shear rates were determined to be the cause of the part discoloration.
The area was then investigated by utilizing both FTIR and DSC (Fig. 10 and 11). Both revealed there was no sign of contamination. Finally, the part underwent intrinsic viscosity (IV) testing to determine if the material had been degraded or not. The results of this test again revealed that the material had not experienced bulk degradation during processing.
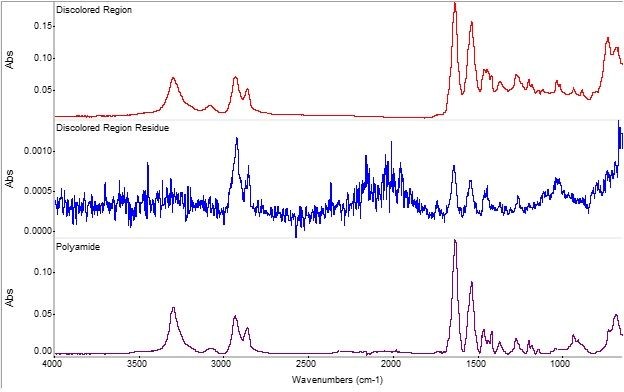
FIG 10 FTIR Spectra highlighting that the discolored area only contains polyamide (nylon) material.
From the investigation thus far, it was confirmed that the cause of the color variation was not due to contamination, but was inherent to the base polymer. Additionally, the testing revealed the material did not exhibit any bulk degradation during processing. Therefore, the investigation turned to the details of the mold design and processing conditions.
Cosmetic issues can often lead to headaches for quality engineers, injection molders and toolmakers.
Given the location of the discoloration, a calculation was performed to determine the shear rate that the material experienced when flowing through the gate. The calculation revealed that the shear rates at the gate exceeded the recommended limit from the material supplier for cosmetic parts. These excessive shear rates led some of the lower molecular weight additives in the resin to degrade and produce the poor surface finish.
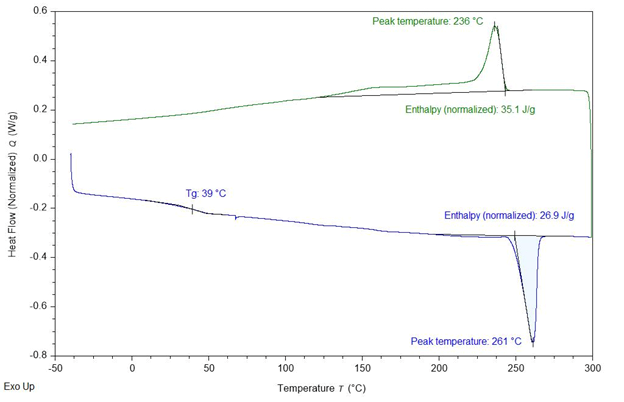
FIG 11 DSC Scan highlighting that the discolored area did not appear to contain any other foreign polymeric materials.
Based on the results of the investigation, it was recommended to increase the gate depth by just 0.005 inch to help reduce the shear rates, which enabled the part to have more consistent color. This simple fix enabled the mold to be accepted and yield to increase for the part.
Cosmetic issues can often lead to headaches for quality engineers, injection molders and toolmakers. When they arise, they can be stressful as the potential sources can be numerous, and their presence often leads to large root-cause investigations. These investigations can yield many avenues to pursue. However, this article has highlighted how taking a step back and generating some data regarding the nature of the defects can help fight through intuition and save time and money for all parties involved.
About the Authors: Erik Foltz is a certified professional Moldflow consultant at the Madison Group. Foltz received his M.S. from the Polymer Engineering Center at the University of Wisconsin. His specialties include plastic part design verification, process optimization and troubleshooting for injection and compression molding, as well as plastics failure. Contact: 608-231-1907; erik@madisongroup.com; madisongroup.com.
Richie Anfinsen received his B.S. from the Department of Composite Materials Engineering at Winona State University. He joined The Madison Group in 2021 upon graduation, performing failure analysis on thermoplastic and composite parts. While at Winona State, Anfinsen worked in the quality assurance lab of specialty compounder RTP Company. Contact: richie@madisongroup.com.
Related Content

Tunnel Gates for Mold Designers, Part 1
Of all the gate types, tunnel gates are the most misunderstood. Here’s what you need to know to choose the best design for your application.
Read More
How to Get Rid of Bubbles in Injection Molding
First find out if they are the result of trapped gas or a vacuum void. Then follow these steps to get rid of them.
Read More
How to Set Barrel Zone Temps in Injection Molding
Start by picking a target melt temperature, and double-check data sheets for the resin supplier’s recommendations. Now for the rest...
Read More
Improve The Cooling Performance Of Your Molds
Need to figure out your mold-cooling energy requirements for the various polymers you run? What about sizing cooling circuits so they provide adequate cooling capacity? Learn the tricks of the trade here.
Read MoreRead Next

Testing: FTIR Spectrophotometer with More Versatility & Reliability
Shimadzu’s IRSpririt is the smallest and lightest FTIR unit from the company.
Read More
The Cosmetic Process Window: Key to a No-Tweak, Robust Process
Establishing a process with the widest possible cosmetic window can help put your injection molding on cruise control.
Read More
Use Molding Simulation To Avoid Surface-Finish Defects
It’s not just for successful mold filling and cooling. Simulation can help predict and overcome cosmetic defects in molded parts.
Read More