
Graphing Injection Pressure: What Should Pack & Hold Curves Show?
Are you sure your press is doing what you want? Visit your controller often to ensure your machines plot the pressure vs. time graph for all your processes. Here let’s focus on pack and hold.
.jpg;width=70;height=70;mode=crop;format=webp)
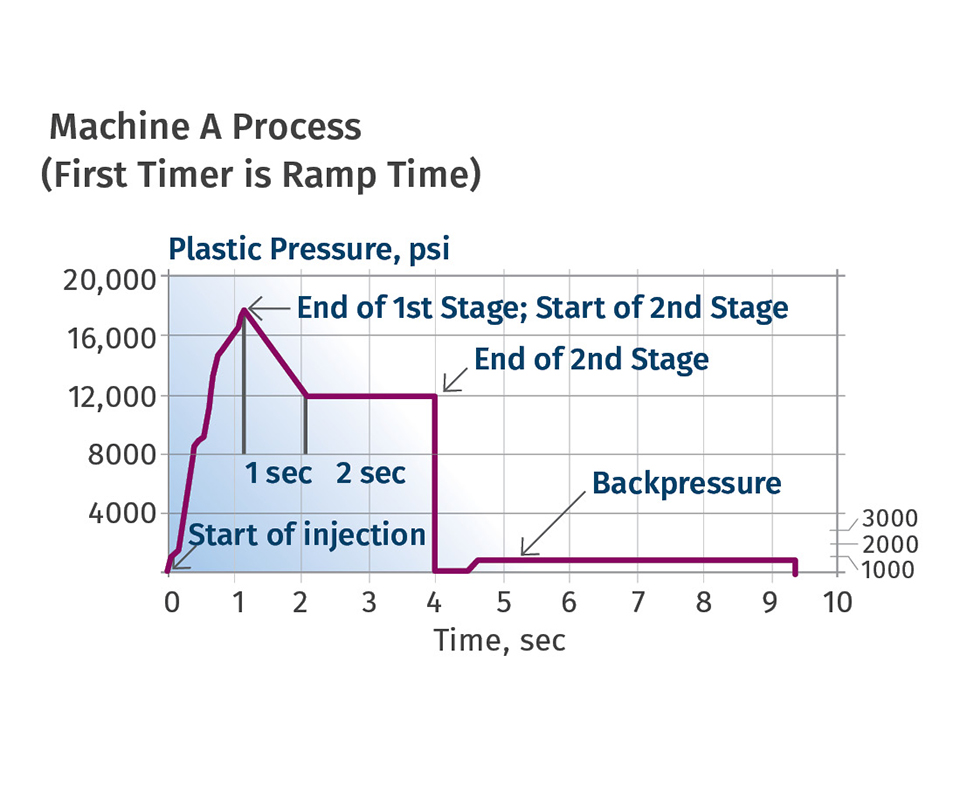
FIG 1 Note the slope of the pressure graph for the first hold pressure and time (1 sec). This is a ramp time. That is, the controller makes the machine go from first-stage pressure to the set second-stage pressure in 1 sec. Shape of curve for hydraulic pressure would be identical.
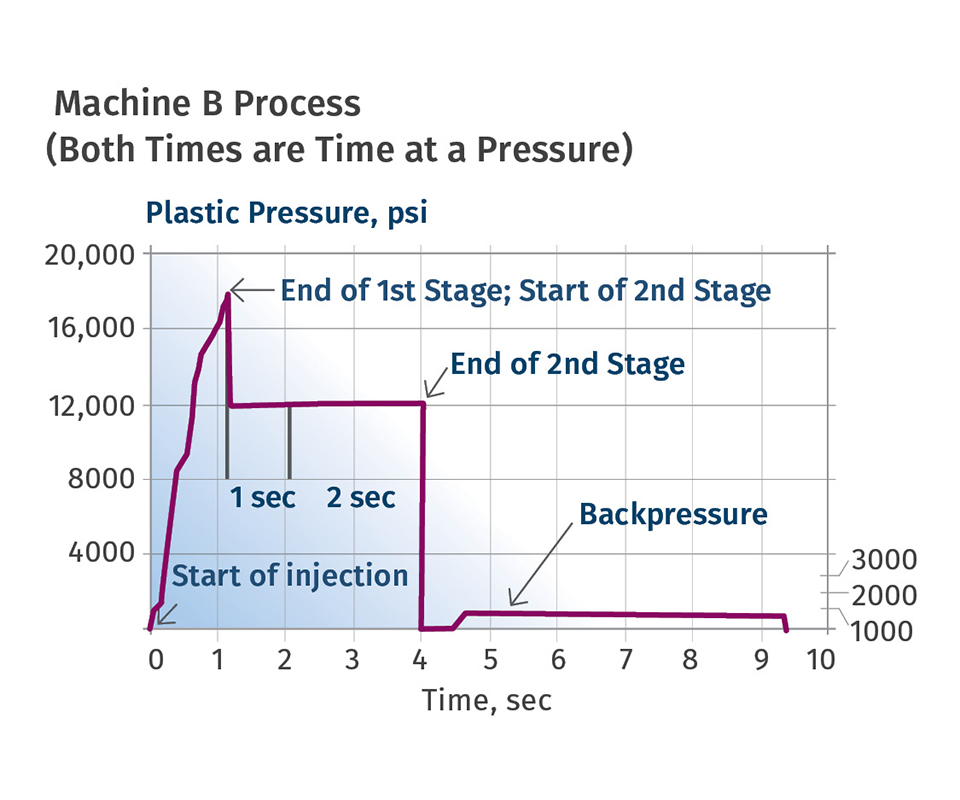
FIG 2 In this process, both timers are times at a given pressure of 12,000 psi for 3 sec total for second stage. The machine switches from first to second stage as fast as it can and provides the rapid, sharp drop in pressure to the set 12,000 psi at the end of fill. This process is significantly kinder and gentler to the parting line, resulting in less parting-line wear. (Shape of curve for hydraulic pressure would be identical.)


In my May 2019 column I prodded you to get the injection pressure vs. time graph working on your injection molding machines. Plotting injection pressure vs. time is a great way to capture your process and learn how your machine and controller operate.
But there are times when the result is not what you’d expect. While this injection-pressure graph varies for different processes, there also are similarities. That is, curves will not look exactly the same for all processes, but should be similar in basic aspects. In this column I’ll focus on pack and hold, also known as second stage.


You may set up the process parameters on the controller the way you want them to be, but the controller and/or machine may not handle the setpoints as you’d anticipate. Pack and hold may seem like two different conditions, but on most machines, they are not two different functions. We will start with the inputs on the controller screen, and then take a look at the possible results.
A typical controller may have a first- and second-stage setup on the same page or different pages, so find the page that sets up second stage. The controller may also give you the option of having different hold pressures for different times. Both of these options are handled differently by machine manufacturers.
I would like to start with a typical input, where second stage is set up to provide the same pressure for two stages (see Table 1). With these identical inputs into Machine A and Machine B it is possible, depending on the machine manufacturer and controller, to establish two different processes (see Figs. 1 and 2, above).

In Fig. 1 note the slope of the pressure graph for the first hold pressure and time (1 sec). The 1 sec on the controller for Machine A is a ramp time. That is, the controller makes the machine go from first-stage pressure to the set second-stage pressure (7000 psi) in 1 sec. The next timer of 2 sec is a time at a given pressure, in this case 7000 psi.
In Fig. 2, Machine B provides a different process than is shown in Fig. 1. In Fig. 2, both timers are times at a given pressure of 7000 psi for 1+2 sec, or 3 sec total, for second stage. The machine switches from first to second stage as fast as it can and provides the rapid, sharp drop in pressure to the set 7000 psi at the end of fill or first stage.
The setpoints on both controller screens are identical, but the processes are not. It depends on how the controller/machine is programed to handle the inputs. The two processes appear to have the same setpoints but they are not the same. The only way to tell what you have is to plot the pressure vs. time graph.
For the process graphed in Fig. 1, the first set time is not a time at the set pressure of 7000 psi but instead a “ramp” time. That is, the controller takes this 1 sec of time input as a ramp time to go from end of first stage to the set second-stage pressure.
So, if there are these two options, which is right? Whichever one makes an acceptable part. In my experience the process graphed in Fig. 2 is normally preferred for acceptable parts. It is significantly kinder and gentler to the parting line, resulting in less parting-line wear.
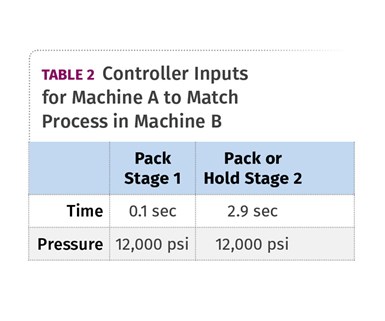
If you wanted Machine A to provide the same second stage as Machine B, see Table 2 to show how to set up the Machine A controller page.
Bottom line: Ensure your machines plot the pressure vs. time graph for all your processes. Visit this page on your controller often. The plot documents the process and provides details that happen too fast for most of us to catch with the human eye. Are you sure your machine is doing what you want?
About the Author
John Bozzelli is the founder of Injection Molding Solutions (Scientific Molding) in Midland, Mich., a provider of training and consulting services to injection molders, including LIMS, and other specialties. Contact john@scientificmolding.com; scientificmolding.com.


Related Content

Online Versions of Process Development Course and Software Launch
NPE2024: FimmTech is introducing online versions of its Nautilus process development software as well as its Scientific Molding and Design of Experiments (DOE) process development course.
Read More
Moving Beyond the Relative Viscosity Curve — Determining Optimum Plastic Flow Rates: Part 3
Molders can use data to determine optimum flow rates by combining cavity imbalance studies with an understanding of machine velocity capabilities.
Read More
Use These 7 Parameters to Unravel the Melt Temperature Mystery
Despite its integral role in a stable process and consistent parts, true melt temperature in injection molding can be an enigma. Learning more about these seven parameters may help you solve the puzzle.
Read More
Moving Beyond the Relative Viscosity Curve — New Method To Find Optimum Plastic Flow Rates: Part 2
Explore the use of the injection unit velocity capability, which determines a machine’s injection speed linearity to find optimum flow rates, and proposes a second method.
Read MoreRead Next

Lead the Conversation, Change the Conversation
Coverage of single-use plastics can be both misleading and demoralizing. Here are 10 tips for changing the perception of the plastics industry at your company and in your community.
Read More
For PLASTICS' CEO Seaholm, NPE to Shine Light on Sustainability Successes
With advocacy, communication and sustainability as three main pillars, Seaholm leads a trade association to NPE that ‘is more active today than we have ever been.’
Read More
People 4.0 – How to Get Buy-In from Your Staff for Industry 4.0 Systems
Implementing a production monitoring system as the foundation of a ‘smart factory’ is about integrating people with new technology as much as it is about integrating machines and computers. Here are tips from a company that has gone through the process.
Read More