How to Quickly Verify Your Machine & Process Setpoints
For a quick check of your process setup, the injection-pressure-vs.-time graph is your best tool.
.jpg;width=70;height=70;mode=crop;format=webp)
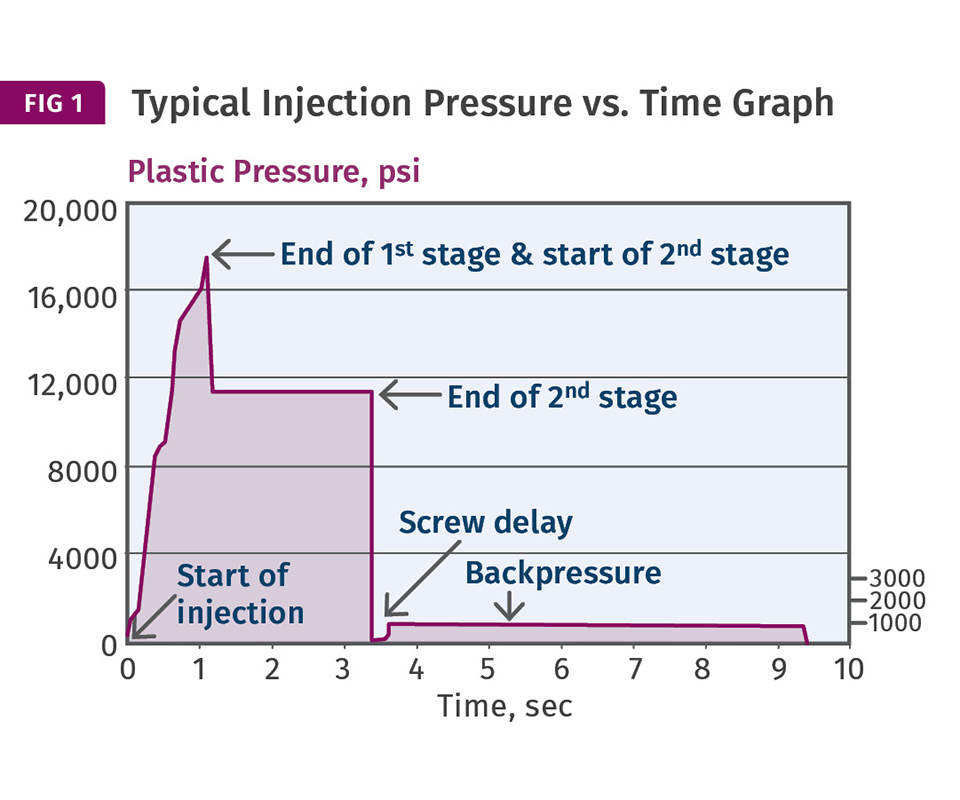
This curve will not look exactly the same for all processes, but should be similar in basic aspects. Overlaying curves of multiple shots gives a quick indication of your process repeatability.
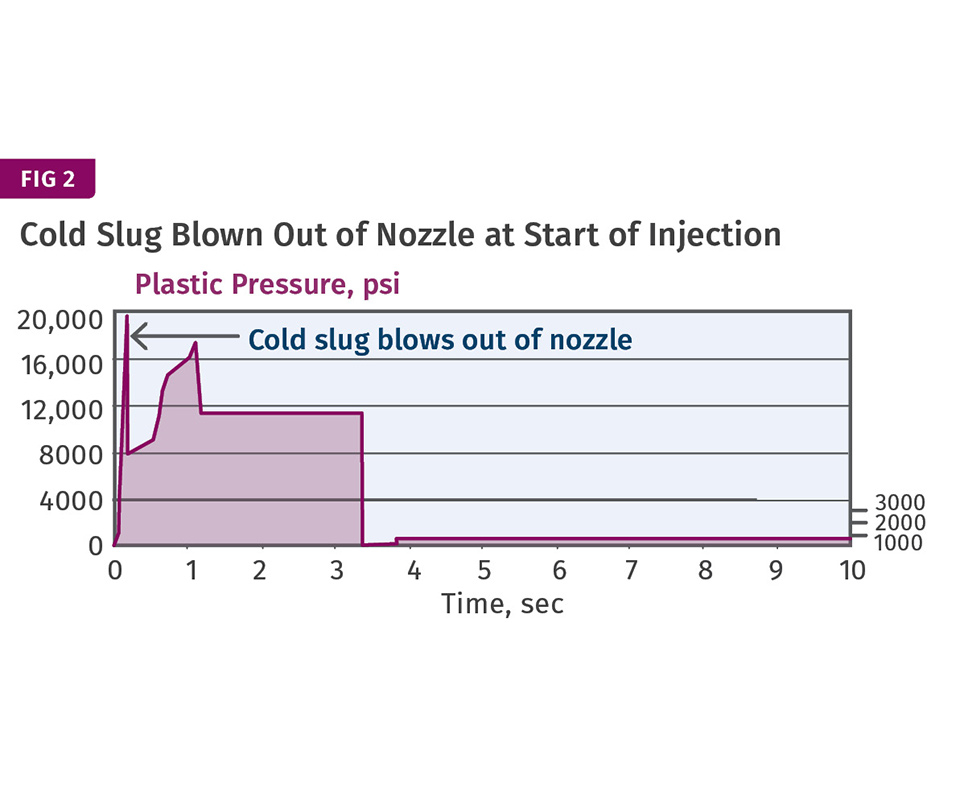
As an example of how the curve can help in troubleshooting, here’s what it looks like when there’s a cold slug in the nozzle. The curve would change further if the slug is not caught in the cold-slug well, but ends up blocking a cavity.


One of the many challenges in injection molding is programing your machine’s interface or controller. There are numerous inputs for the various functions, such as injection, clamp movement, screw recovery, ejection, temperatures, etc. There are no standard screens, and even the same manufacturer often changes the controller screens with different models. Now add in the fact that most processors have to deal with several different brands in their shop, and programming becomes a daunting task.
The logic of these controllers can be intuitive to you and challenging for me, and vice versa. We all have our favorites. But we all want the press to do what is needed to make an acceptable part. You know what you want the controller and machine to do and you may think you have it programmed correctly. But do you, in fact, have the correct settings, or have you possibly typed in errors? How do you verify that the machine is set to do what you want, even if you have correctly entered the parameters?


Fortunately, you can perform a quick check that shows that your process is set up correctly and giving you what you want. With a focus on the injection and hold phase of processing, the best way to check your settings is to plot injection pressure vs. time. Most machine controllers have this graphing/plotting capability. Not only will this verify what the machine is doing on injection, but it also will tell you if the machine is acting repeatably. That’s the good news.
The bad news is setting up this controller screen will take some time, as they are not the easiest screens to deal with. To be honest, these graphic screens can often be confusing, but the preparation is worth the effort. Checking this graph will not only save you significant time and hassle, but also will make you a better molder. So bite the bullet and get it done.
Usually you have several options: injection pressure, injection velocity, screw position, etc.—but keep this simple. Start with and learn one graph at a time. My choice is injection pressure vs. time (not screw position). Machines do not always do what you expect, but this graph will verify that the machine is doing what you want. It is a picture of your process. Where do you start?
To minimize frustration and get this done as quickly as possible, ask around to see if one of the other process technicians in your company has figured it out so they could teach you. If there is no one in-house to help you, call your machine supplier and ask if there is a technical representative familiar with setting up the graphics function of your controller. The graphics can usually plot more than one curve at a time, but start with injection pressure vs. time and choose a particular color for this curve. Standardize on this color for all your presses so you will know that color displays injection pressure. The graph should plot the plastic injection pressure (not hydraulic pressure) vs. time curve, if possible. Hydraulic pressure vs. time is my second choice. (The two curves will look similar but have different pressure scales.) Once set up, this page will be a go-to page to make a quick check to see if the process is running as desired.
Some suggestions to make this as useful as possible:
1. Vertical (y-axis) scale should be pressure—say, 0 – 25,000 psi plastic pressure.
2. Horizontal (x-axis) scale should be time, covering about three-quarters of your cycle time.
3. Do NOT turn on auto scaling, keep the scale fixed, as you will see changes easier.
4. Look for the ability to overlay the pressure curves for successive shots—a great way to see if the process is repeatable.
5. If possible, capture or store a reference curve when you are making acceptable parts. This should be helpful if QC later finds parts that are out of tolerance.
What should the graphs look like and what should you look for? See Fig. 1, a plot of plastic injection pressure vs. time. While there is no “typical” graph, there should be similarities. Machine sequences are noted for reference. All curves will not look exactly like this, but they should be similar.
Imagine that if you could overlay several shots you could easily see if the machine was repeatable, and if there were a machine glitch, you could easily tell at what stage it was occurring and whether it was happening on every shot or random.
An example of an issue that should be corrected appears in Fig. 2, which is another plot of plastic injection pressure vs. time. This curve shows what a cold slug in the nozzle looks like. Note that this cold slug will not always be caught in the cold-slug well. It can easily wind up blocking or partially blocking a gate.
Bottom line: The pressure-vs.-time curve is a powerful picture of your process. It provides results, not setpoints. Understanding the intricacies of these curves will provide better part consistency, process understanding, and faster troubleshooting. Now is the time to start using it.
ABOUT THE AUTHOR: John Bozzelli is the founder of Injection Molding Solutions (Scientific Molding) in Midland, Mich., a provider of training and consulting services to injection molders, including LIMS, and other specialties. Contact john@scientificmolding.com; scientificmolding.com.
Related Content

The Effects of Temperature
The polymers we work with follow the same principles as the body: the hotter the environment becomes, the less performance we can expect.
Read More
How to Select the Right Tool Steel for Mold Cavities
With cavity steel or alloy selection there are many variables that can dictate the best option.
Read More
A Simpler Way to Calculate Shot Size vs. Barrel Capacity
Let’s take another look at this seemingly dull but oh-so-crucial topic.
Read More
Why (and What) You Need to Dry
Other than polyolefins, almost every other polymer exhibits some level of polarity and therefore can absorb a certain amount of moisture from the atmosphere. Here’s a look at some of these materials, and what needs to be done to dry them.
Read MoreRead Next
Why (and What) You Need to Dry
Other than polyolefins, almost every other polymer exhibits some level of polarity and therefore can absorb a certain amount of moisture from the atmosphere. Here’s a look at some of these materials, and what needs to be done to dry them.
Read More
People 4.0 – How to Get Buy-In from Your Staff for Industry 4.0 Systems
Implementing a production monitoring system as the foundation of a ‘smart factory’ is about integrating people with new technology as much as it is about integrating machines and computers. Here are tips from a company that has gone through the process.
Read More
How Polymer Melts in Single-Screw Extruders
Understanding how polymer melts in a single-screw extruder could help you optimize your screw design to eliminate defect-causing solid polymer fragments.
Read More