Last month we began a discussion regarding the problems associated with the traditional treatment of plastic material properties in terms of single-point data. Over the next few articles we will delve into this issue more deeply and provide some alternatives that are well within the capability of current technology. This month we will address the properties that are derived from tensile testing. Most data sheets will provide one or two data points regarding tensile properties.
A relatively thorough characterization will result in values for tensile stress and elongation at yield and at break. For ductile materials such as polyethylene or polycarbonate, the yield and break points are relatively far apart on the elongation scale; therefore, it is useful to know about the properties at both points. For very rigid, brittle materials the yield and break points may be essentially the same; therefore, listing one of these benchmarks is sufficient. Of course, the vast majority of the data sheets that do provide these data points make the measurements only at room temperature.
It is important to remember that even if a data sheet gives stress and strain values at both yield and break, these simply represent points on a curve, just as the modulus we discussed last month is a point on a curve. To truly understand the behavior of a material, we need the curve. Stress-strain curves can be generated in a variety of modes, but tensile results are probably the most useful because they result in a well-defined failure point. Flexural tests typically are stopped when the sample reaches 5% strain and for many materials it is unlikely that an outright failure will occur in either flex or compression. Therefore, the tensile stress-strain curve is one of the most useful pieces of information that we can have when trying to understand the full spectrum of mechanical behavior in a material.
Figure 1 shows the initial portion of a tensile stress-strain curve for a 10% glass-fiber reinforced polycarbonate. This curve stops just beyond the yield point so that the details contained in the initial stages of the test can be easily viewed. The actual elongation at break occurs at approximately 35% strain and a stress of 6500 psi. The yield point is of interest because it represents the point where no further increase in stress is required to produce an increase in strain. Therefore, we should not expect to be able to use the material above the yield stress for even a very short duration. And even if we keep the time frame very short, we can be quite certain that whatever strain that does result will be non-recoverable.
Figure 1 contains the key points that we customarily obtain from the data sheet; the yield stress and strain as well as the modulus. As we pointed out last month, the modulus only applies to the region of the stress-strain curve where the plot is linear, where the stress and strain are in proportion. Beyond the proportional limit, the plot changes from a line to a curve and we have entered the region of plastic deformation. Sustained application of stresses above this point will also result in non-recoverable deformation.
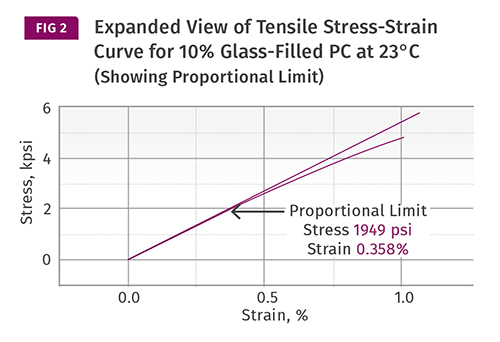
It is difficult to tell from Fig. 1 exactly where this proportional limit falls, but the expanded view in Fig. 2 shows that it is located at a stress of just under 2000 psi and a strain of 0.358%. This is less than 25% of the yield stress and less than 8% of the yield strain. As we move higher on the curve, the deviation from linearity increases. In other words, for each incremental increase in stress, the increase in the associated strain becomes larger. For example, if we increase the stress from 1000 to 2000 psi, the instantaneous strain increases by 0.19%. However, when the stress increases from 6000 to 7000 psi, this same incremental change produces an increase in strain of 0.57%, three times greater.
This is important because it illustrates how the progressive increase in nonlinear behavior of plastic materials influences their performance. This becomes even more critical when time is brought into the equation. Constant loading (creep) or cyclic loading (fatigue) reduces the maximum working stress that a plastic material can withstand as a function of time. The longer the product needs to function, the less stress it will be able to withstand. This explains why engineers who are used to working with metals are surprised that plastic materials cannot operate as close to their yield point as metals can. It also explains why people who conduct finite-element analysis (FEA) can get into so much trouble when they perform a linear analysis on plastic materials. Linearity only applies for a very small segment of the stress-strain curve.
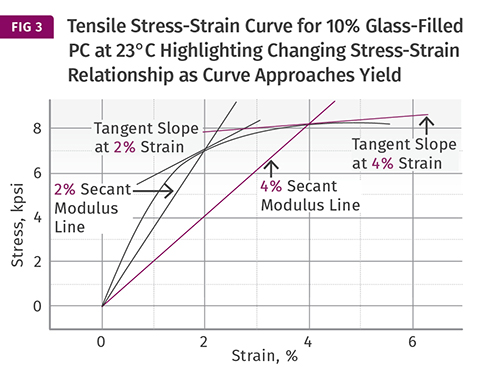
Short cuts are often taken by calculating a secant modulus, as shown in Fig. 3. This involves drawing a straight line from the origin to a specific point on the curve associated with a particular strain. Usually this is done to the 1% or 2% point. Because plastic materials are nonlinear at these strains, the straight line that defines the secant modulus represents a reduction in the property associated with the linear portion of the stress-strain plot. In the case of this polycarbonate, the slope of the line connecting the origin to the coordinate at 2% strain gives a modulus of 350 kpsi, significantly lower than the 544 kpsi shown in Fig.1. If this same operation is performed to the point at 4% strain, the modulus associated with this line is only 210 kpsi.
But the concerns regarding long-term load-bearing properties become even greater when we understand that the rate at which a progressive increase in strain occurs under the influence of a particular stress is governed more precisely by the slope of the line drawn tangent to the stress-strain curve at the point of interest. If we look at things in this way, we can see that the slope of the line tangent to the curve at 2% strain is only 120 kpsi and at 4% it is only 19 kpsi. The rate of increase in creep strain associated with stresses in the non-linear region of the curve will be a reflected in this slope, so that as the initial strain associated with a particular load case increases, the time that the material can function before failing becomes significantly shorter.
So the question is this: How are engineers supposed to make intelligent decisions about the fitness-for-use of a material under load if they do not have access to the actual stress-strain curve? The yield point is nice to know because it represents an upper performance limit for very short-term behavior. But for insights into long-term applications we need to know how we arrived at the yield point. It is possible to draw curves of several different shapes that all start at zero and end up at approximately the same yield point. These different paths signal that the performance of the materials will be different. And we have not even begun to consider the effects of temperature on the shapes of these curves. That will have to wait until next time.
Editor’s note: You can read the next part in the series by clicking here.
ABOUT THE AUTHOR: MIKE SEPE
Mike Sepe is an independent, global materials and processing consultant whose company, Michael P. Sepe, LLC, is based in Sedona, Ariz. He has more than 35 years of experience in the plastics industry and assists clients with material selection, designing for manufacturability, process optimization, troubleshooting, and failure analysis. Contact: (928) 203-0408 • mike@thematerialanalyst.com.

.jpg;width=70;height=70;mode=crop;format=webp)