
Understanding Polymer Flow: Interpreting the Viscosity Curve
Take the time to do the viscosity curve on new molds. You will learn more in that hour than many learn in years about the process for this tool.
.jpg;width=70;height=70;mode=crop;format=webp)
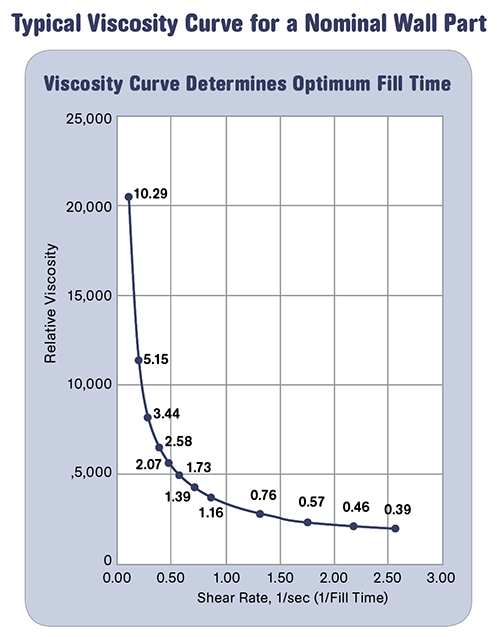
The viscosity curve is a plot of the polymer viscosity vs. shear rate. Data is plotted here on linear scales rather than the log-log method. Interpreting this data will guide you to an appropriate fill time for this particular mold and resin.


Let’s take a step back in the development of Scientific Molding with a review of one of the benchmarks of the technology: The on-machine viscosity curve. When it was first presented in the late 1980s it was not well accepted, but some 20 years later it has gained a substantial foothold, perhaps to the point of being a bit overrated.
Measuring a viscosity curve on the injection machine took 20 years to gain wide acceptance.
For those new to Scientific Molding, the viscosity curve is a plot of the viscosity of a polymer vs. shear rate (see graph). Data here is plotted on linear scales rather than the academic (and more correct) log-log method. I like the linear plot because it shows the magnitude of viscosity variation as you change shear rate by changing injection velocity or fill time. Data is obtained by doing this experiment on an injection machine with the mold and resin you plan to run.


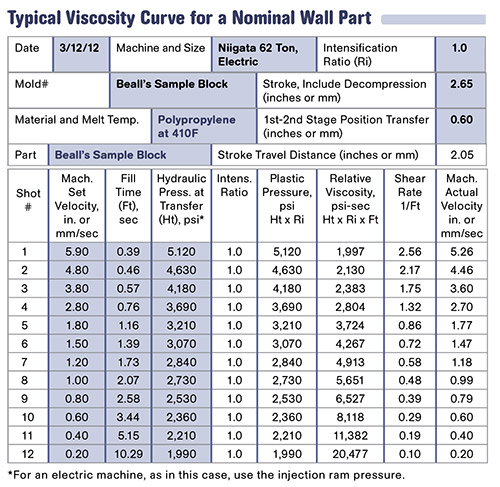
Start the experiment by taking hold pressure off. Lower the hold pressure to near zero; then, starting with a high injection velocity, make a short shot, 99% full by volume. Take data as you gradually lower the injection velocity—don’t adjust anything but injection velocity. From the table below, you can use the injection pressure at transfer and fill time to develop the viscosity curve. (For those who want to know the science behind the terms in the chart, the parameters in this experiment are related by a fluid dynamics expression known as the Hagen-Poiseuille equation. You can find the equation on Google.com.)
After interpreting this data in relation to the machine, resin, and part, the processor is guided to a fill time for this particular mold and resin. This fill time is now set for the life of the project. Once you become adept at the procedure and log the data into a spreadsheet, the experiment should take about 30 minutes. That’s time well spent to get the data for determining fill time and the start of a production-capable process.
Viscosity is influenced more by shear rate—injection speed—than temperature or even resin lot variations.
But how do you interpret the curve? The concept is that if you understand how plastic flows and fills a mold, you can use this information to make robust processes that produce consistent parts. Starting with the basics: The graph shows a typical curve. In fact, once you do a few of these you’ll recognize that if you have good data that spans a decent range of fill times, the curves all have the same shape. Only the ranges of the scales change. That is the way it should be—plastics are non-Newtonian, meaning they all change viscosity with changes in injection rate or fill time. In fact, viscosity is influenced more by shear rate—injection speed—than temperature or even resin lot variations.
Check out the numbers in the table accompanying the graph. If you round up a bit, the viscosity at the fastest speed, a fill time of 0.39 sec, is about 2000 psi-sec. If you double the viscosity it would be 4000, five times the viscosity would be 10,000, and 10 times stiffer would be 20,000. So in this case, just by changing injection rate you can change the viscosity 10-fold or an order of magnitude. Temperature and lot variations cannot come close.
If the biggest single factor in the viscosity of most plastics is injection speed or fill time, what does that mean for processing? First, you must keep the fill time the same to have a stable process that can make the same part on any machine. That is, shot to shot, summer to winter, machine to machine. Our range in this case is a tight ±0.04 sec. It does not matter what injection velocity you set on any given machine—the critical parameter for the plastic is keeping the fill time the same. This keeps the shear rate the same. (A little caveat here: If it is a multi-cavity tool, fill balance is important.)
The next step in interpreting the data may be asking this question: Where on the curve do want the process to run? You have to be somewhere on the curve, because your experiments covered the entire range of the machine: You went as fast as the machine could go to as slow as it could go. Looking at the data you can see a large change in viscosity on the left side of the curve. That does not bode well for a stable process. For process stability, the plastic likes the flat section of the curve, as shown in the center to right side of graph. Viscosity is not changing much in this section; it is a flat line, something like the way water flows. In other words, the plastic likes to go fast; it has lower viscosity, which does not change much with small speed variations.
Because of this, many processors pick a point near the shortest fill time. Unfortunately, things aren’t that simple, as the part, mold, machines (other machines this mold may be scheduled for), or the application often require some tough compromises. For example, if you are molding optical lenses, you will be forced to be on the steep section of the curve, as there is too much birefringence at the fast injection speeds. Plating or painting also require slow injection speeds and longer fill times. Your machine may be pressure-limited, or perhaps cannot control the ram speed. The data is just telling you what the plastic wants to do; all the other components of making a good part have to be considered by testing. This is what I meant above when I used the term “overrated.”
Don’t waste hours on developing injection speed profiles, when the test parts from the velocity-curve experiment provide the data you need.
What about profiling injection? Most machines today can profile five to 10 velocity steps for part filling. Does the data tell you when to change speeds and what speeds to use? Some molders waste hours on this, to the point of changing the profile daily. However, the test parts from the velocity curve experiment provide the data you need.
Line up all the shots in order, fast to slow or slow to fast. Inspect each to see if there are any changes in appearance as you changed the fill time. If all parts are short and sinky with no blush, flash, streaks, burns, or other defect, then there is no reason to profile injection speed. If you do see flash or burns, those are mold issues that should be fixed, not worked around. You will have to add time to the cycle and that will kill your profit margin, so fix the tool. Keep it simple and use one injection speed. I would estimate that 80% of all molding jobs should not need profiling.
In short, take the time to do the viscosity curve on new molds. You will learn more in that hour than many learn in years about the process for this tool. But remember that there are other components of making a good part that have to be factored into this complex equation.
ABOUT THE AUTHOR
John Bozzelli is the founder of Injection Molding Solutions (Scientific Molding) in Midland, Mich., a provider of training and consulting services to injection molders, including LIMS, and other specialties. E-mail john@scientificmolding.com.


Related Content

How to Configure Your Twin-Screw Barrel Layout
In twin-screw compounding, most engineers recognize the benefits of being able to configure screw elements. Here’s what you need to know about sequencing barrel sections.
Read More
Polyethylene Fundamentals – Part 4: Failed HDPE Case Study
Injection molders of small fuel tanks learned the hard way that a very small difference in density — 0.6% — could make a large difference in PE stress-crack resistance.
Read More
Understanding the Effect of Pressure Losses on Injection Molded Parts
The compressibility of plastics as a class of materials means the pressure punched into the machine control and the pressure the melt experiences at the end of fill within the mold will be very different. What does this difference mean for process consistency and part quality?
Read More
The Fundamentals of Polyethylene – Part 1: The Basics
You would think we’d know all there is to know about a material that was commercialized 80 years ago. Not so for polyethylene. Let’s start by brushing up on the basics.
Read MoreRead Next

Melt Flow Rate Testing—Part 4
Few molders perform the test in-house. Of those that do, most don't understand why they are doing it or what they are measuring.
Read More
For PLASTICS' CEO Seaholm, NPE to Shine Light on Sustainability Successes
With advocacy, communication and sustainability as three main pillars, Seaholm leads a trade association to NPE that ‘is more active today than we have ever been.’
Read More