Understanding the Effect of Polymer Viscosity on Melt Temperature
Every processor should get hold of the viscosity curves for the polymers they use or contemplate using in their operations, and learn how to read them.
Plastics extrusion has been around for almost 100 years, but despite its extensive history, polymer shear rate/viscosity curves are still not widely used or understood. I was recently asked by an experienced pipe processor why the melt temperature was so high on a new polymer his company was evaluating. They had changed from a fractional-melt-index (0.35 MI) HDPE to a 0.06 MI bimodal HDPE, and were trying to hold the temperature down to accommodate their downstream cooling capacity. They tried drastically reduced barrel temperatures—but not only were they unable to bring the melt temperature down, they overloaded the drive by extracting too much heat from the system.
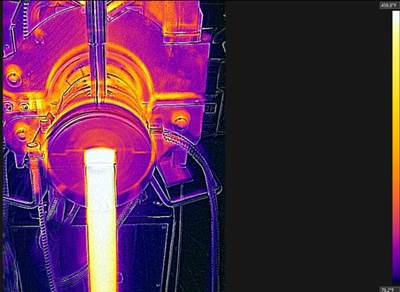
Basically, the melting and melt-temperature rise in an extruder occur largely by “stretching” any melted polymer contained in the space between the barrel bore and the screw (see illustration). The barrel is heated to help initiate the first melting, but then provides primarily a thermal jacket over that stretching process. The polymer melt sticks rigidly to both the barrel wall and the screw surface (see the highlighted strip in the illustration). The rotating screw then stretches or “shears” the polymer in that space. It’s like the polymer were made up of many tangled rubber bands all attached to the barrel and screw.
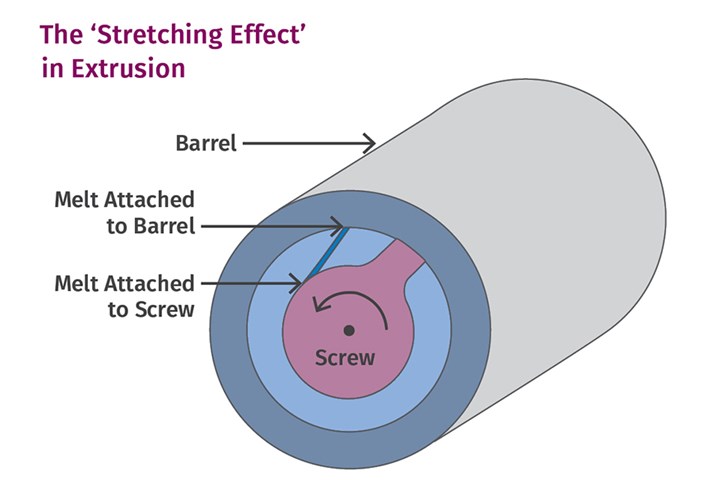
In order for the screw to rotate it has to stretch the rubber bands, and that requires a certain amount of power from the drive motor. The stretching transfers the energy from the screw drive to the polymer and results in an increase in temperature of the polymer. That transfer is largely responsible for the heating of the polymer, not the barrel temperatures. The amount of energy required to rotate the screw then depends on the polymer’ viscosity—that is, the resistance of the rubber bands to stretching.
In the example above, when changing from a 0.35 to a 0.06 MI, the polymer viscosity changed from 1200 Pa⋅s to 2200 Pa⋅s at the same shear rate and temperature. That’s an 83% increase in viscosity. Since the polymer required 83% more power to stretch the melt, that additional power input was retained in the polymer, increasing the melt temperature.
Polymers are non-Newtonian, so they change viscosity with both temperature and shear rate. Determining the actual viscosity in the process requires a set of shear rate/viscosity curves evaluated at several temperatures to determine the viscosity difference between two polymers of the same type. Melt flows or melt index numbers are not a good indicator of the actual difference in viscosity. In this case the difference in the melt flow numbers (0.35/0.06) is almost 6:1, while the difference in viscosity is only 1.83:1. So making processing judgments from that data can lead to large errors in expected results.
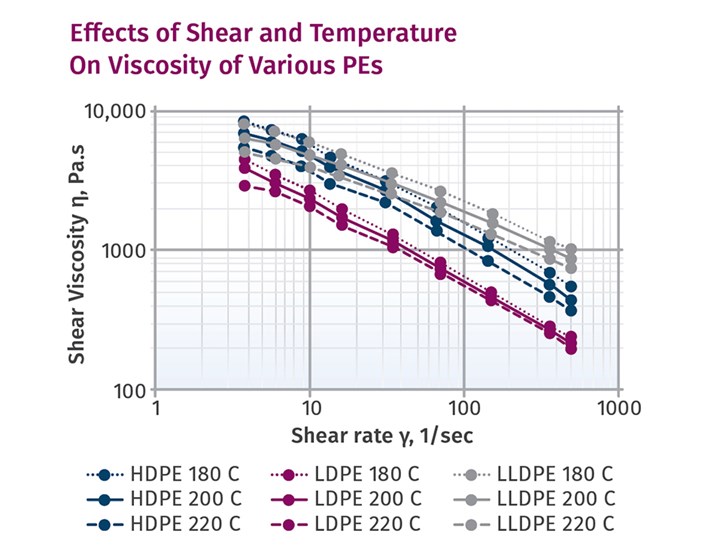
I consider the shear rate/viscosity data to be the most important bit of information I can get for evaluating the processing of a particular polymer. I encourage every processor to get hold of the curves for the polymers they use or contemplate using in their operations and learn how to read them. Polymers may have the same viscosity at a certain shear rate and temperature, but since that may only occur at a single point it’s important to see the whole curve for both its slope and offset based on different temperatures. Accurate comparisons can be made only for polymers of the same type, as there are molecular factors that can account for other differences that require training in rheology to fully understand; but with same polymer the shear rate/viscosity curves take all that into account.
The shear rate/viscosity data is the most important bit of information for evaluating the processing of a particular polymer.
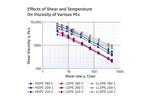
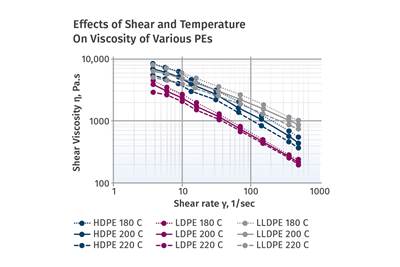
This accompanying graph shows the differences for three different types of PE of similar melt flows, but they are quite different. Notice the closeness of the LDPE curves at different temperatures, indicating the minor effect temperature has on the viscosity, while that’s not true for the HDPE and the LLDPE. The LDPE curve has the greatest slope, indicating the greatest sensitivity to shearing. Notice that at the shear rate of 100 sec-1 the LLDPE shows a viscosity of about 2000 Pa⋅s, while the LDPE shows about 700 Pa⋅s or almost three time the viscosity. Using shear-rate/viscosity curves provides for much more quantitative judgments of the effect of changing polymers on the processing results.
About the Author: Jim Frankland is a mechanical engineer who has been involved in all types of extrusion processing for more than 40 years. He is now president of Frankland Plastics Consulting LLC. Contact jim.frankland@comcast.net or (724) 651-9196.
Related Content
How Much L/D Do You Really Need?
Just like selecting the extruder size and drive combination, the L/D should be carefully evaluated.
Read MoreHow to Select the Right Tool Steel for Mold Cavities
With cavity steel or alloy selection there are many variables that can dictate the best option.
Read MoreWhy (and What) You Need to Dry
Other than polyolefins, almost every other polymer exhibits some level of polarity and therefore can absorb a certain amount of moisture from the atmosphere. Here’s a look at some of these materials, and what needs to be done to dry them.
Read MoreDensity & Molecular Weight in Polyethylene
This so-called 'commodity' material is actually quite complex, making selecting the right type a challenge.
Read MoreRead Next
Part Two: Determining Viscosity Data Using a Slit Die Viscometer
Using a slit-die viscometer connected to a lab extruder can generate accurate data on melt viscosity at various shear rates and different temperatures—a useful QC tool in processing.
Read MorePART ONE How to Determine Viscosity Data Using a Slit-Die Viscometer
Using a slit-die viscometer connected to a lab extruder can generate accurate data on melt viscosity at various shear rates and temperatures, a useful QC tool in processing.
Read MoreUnderstanding Viscosity in Extrusion
Both the power-law coefficient and the consistency index must be considered to calculate viscosity.
Read More
.jpg;width=70;height=70;mode=crop)

